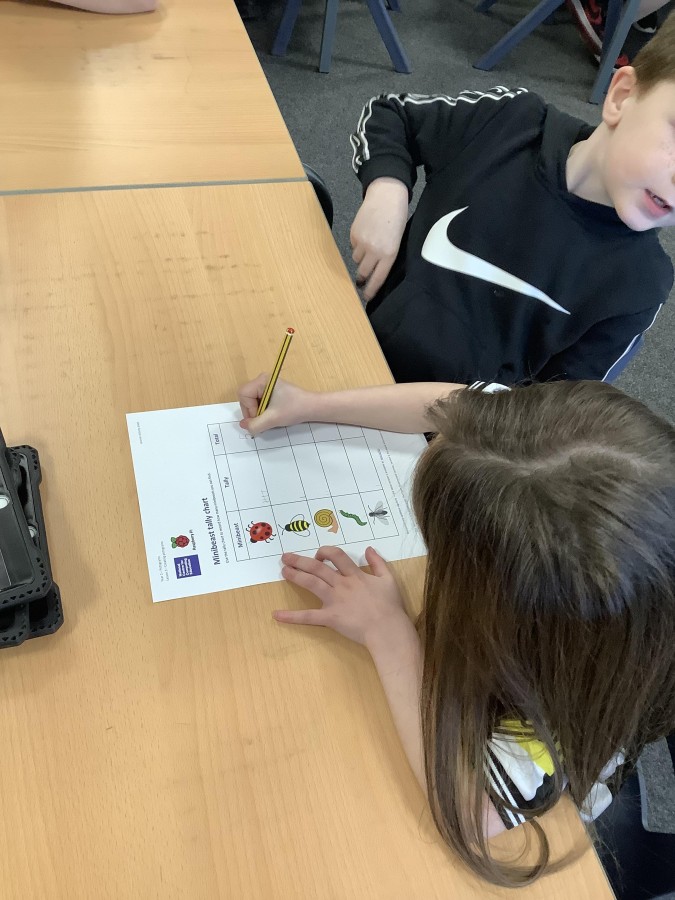
This term in Computing, Year Two have been learning how to represent data using pictograms.
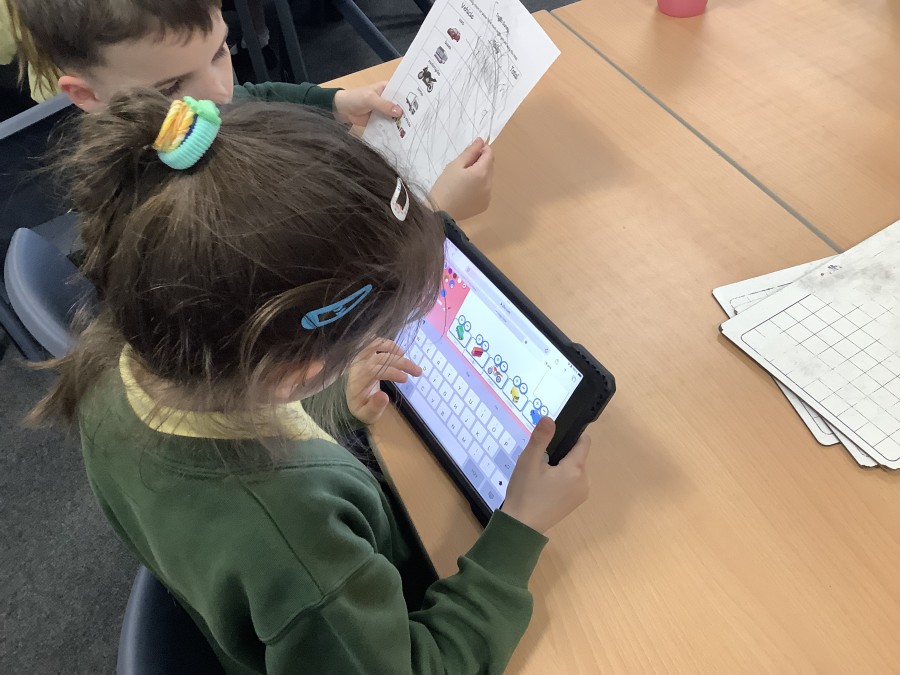
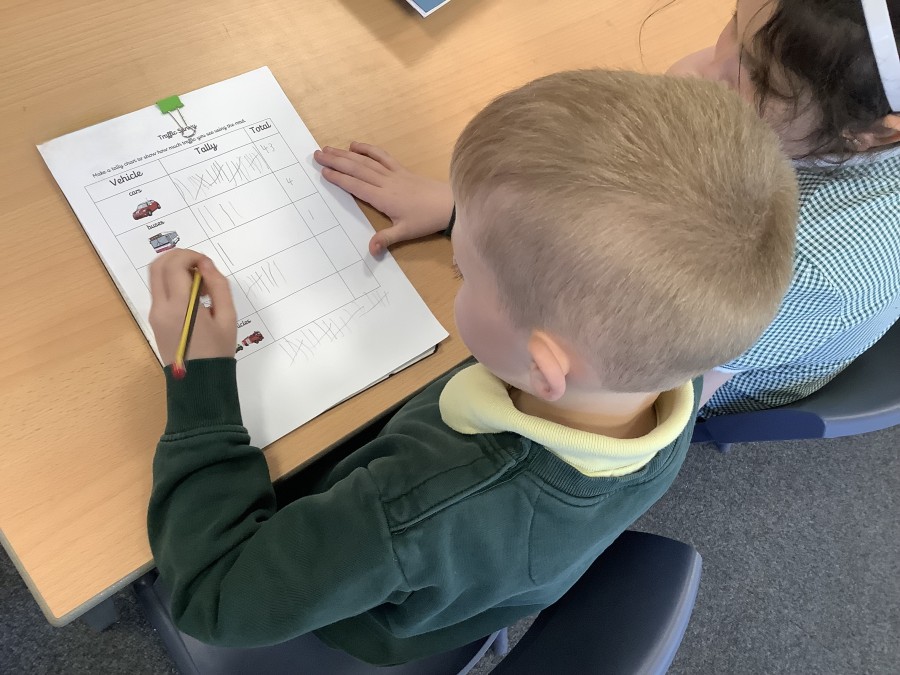
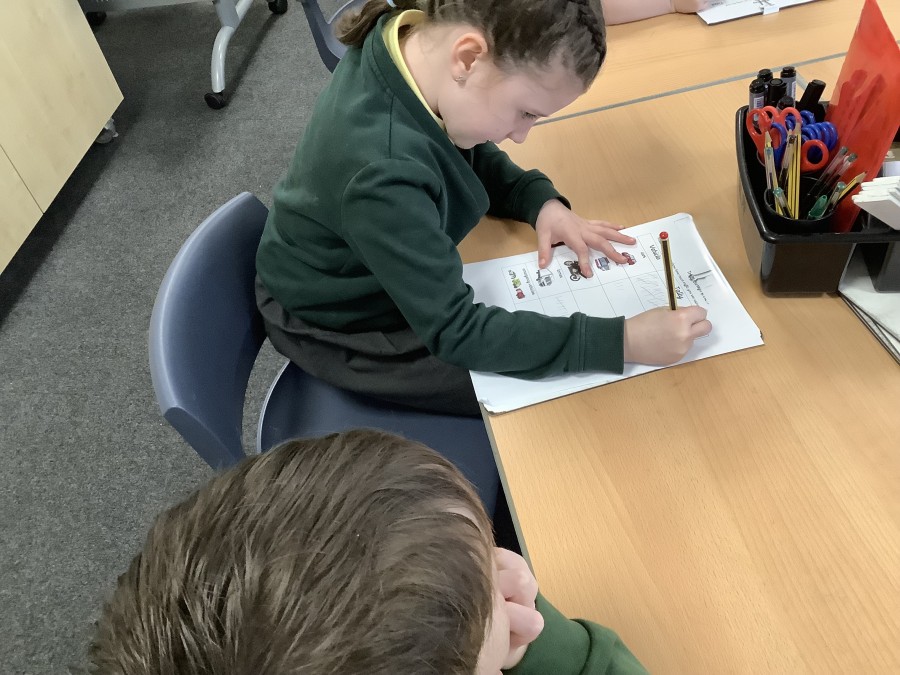
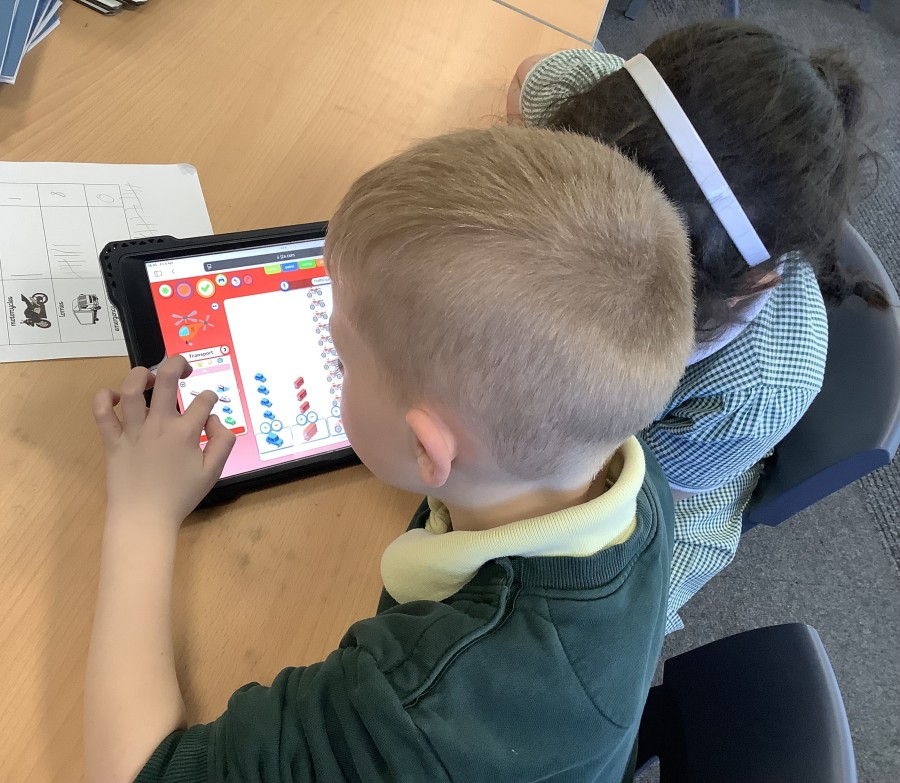
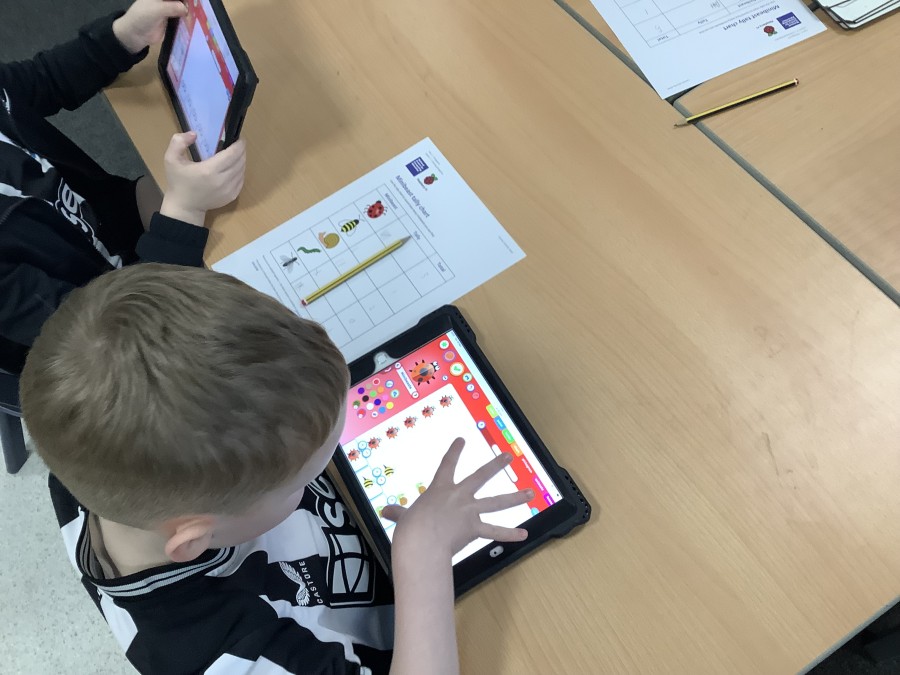
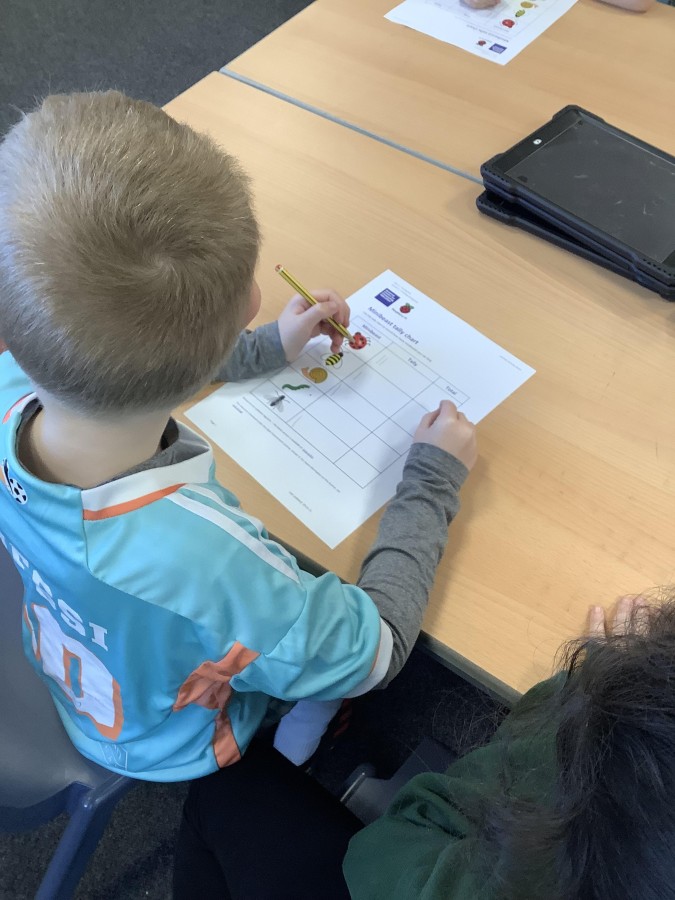
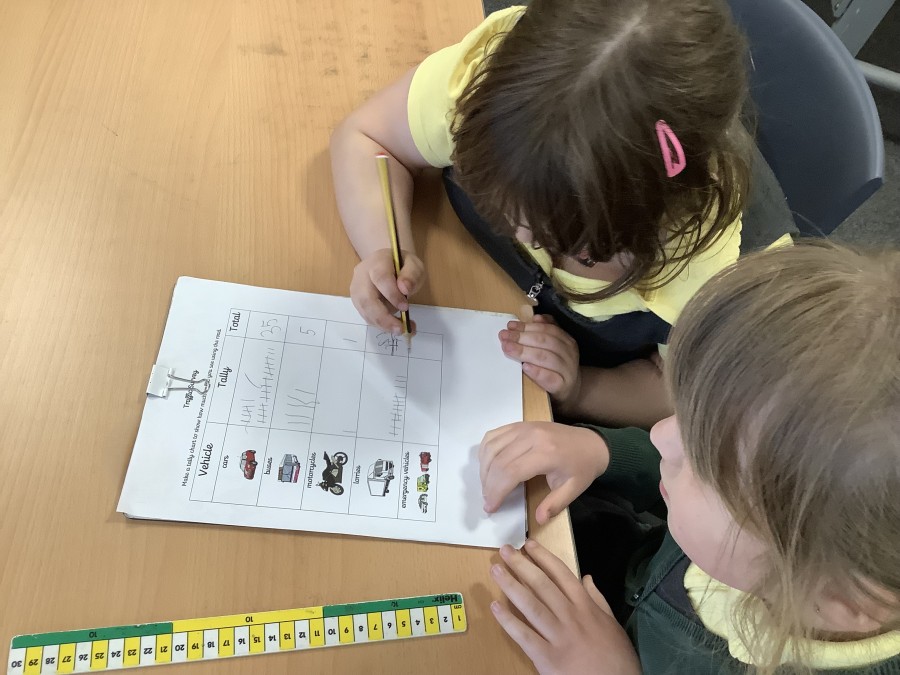
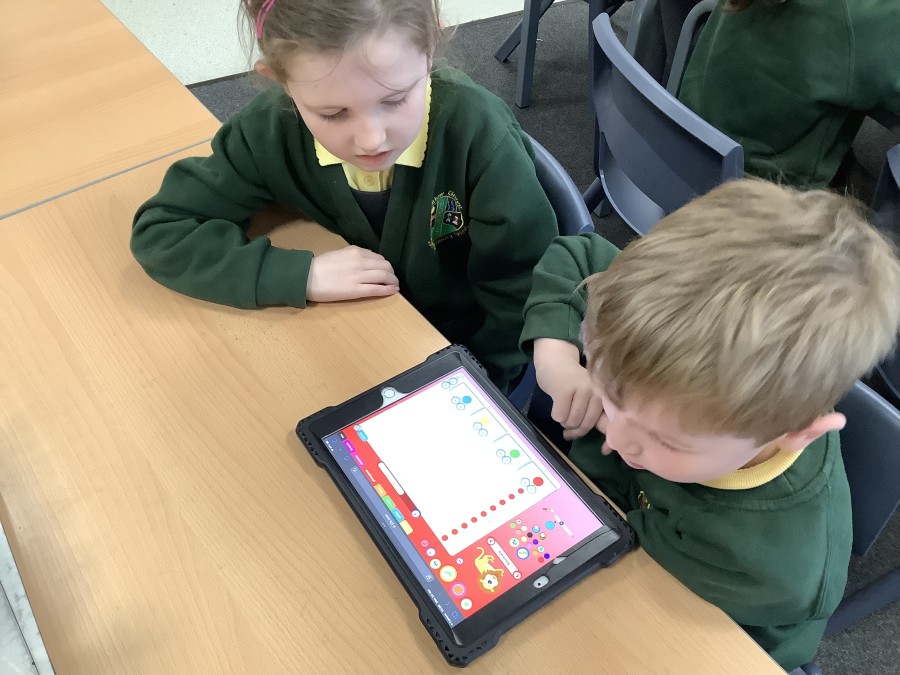
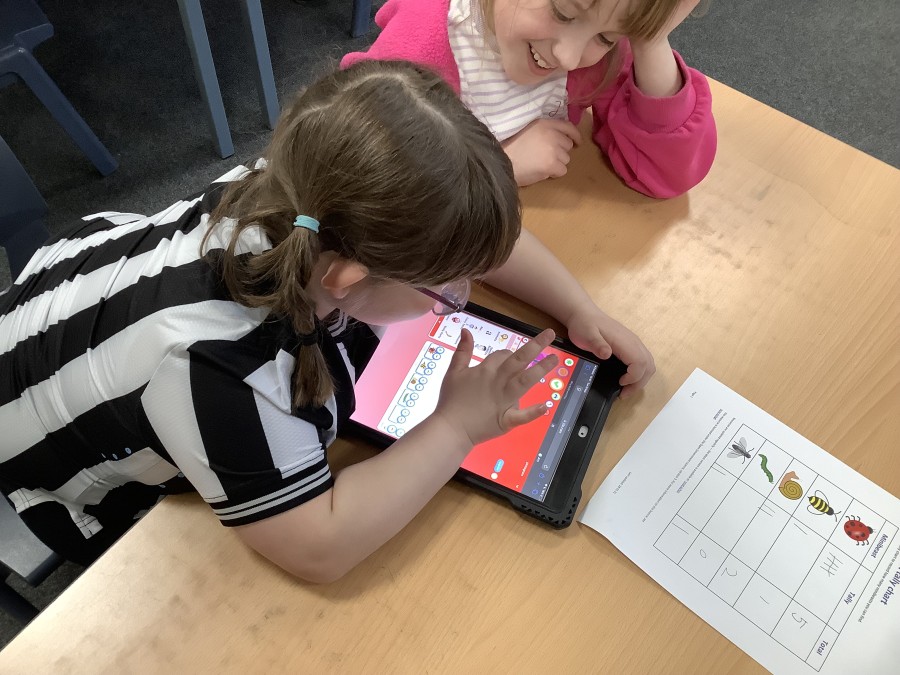
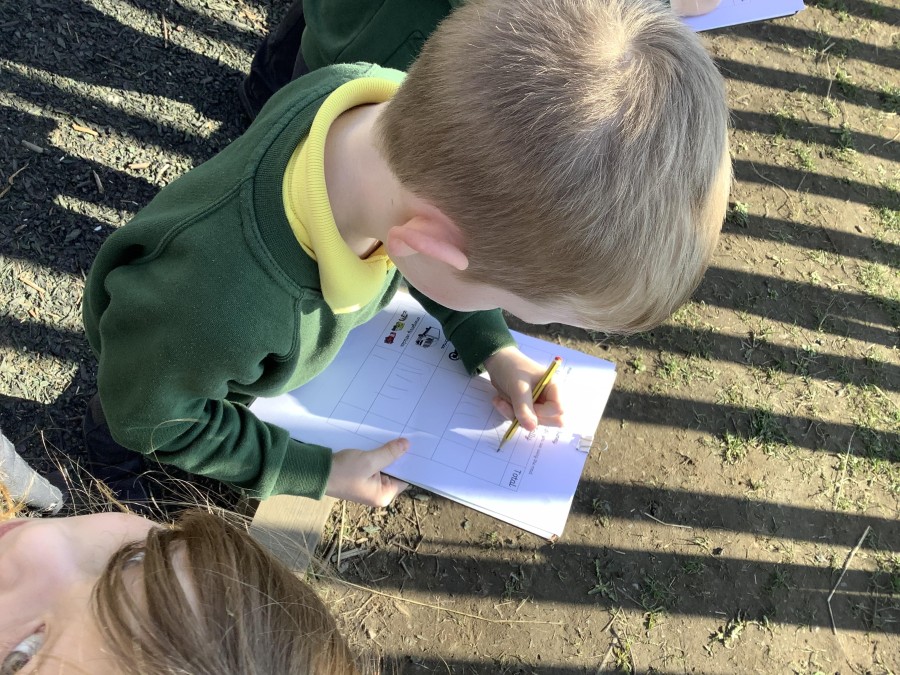
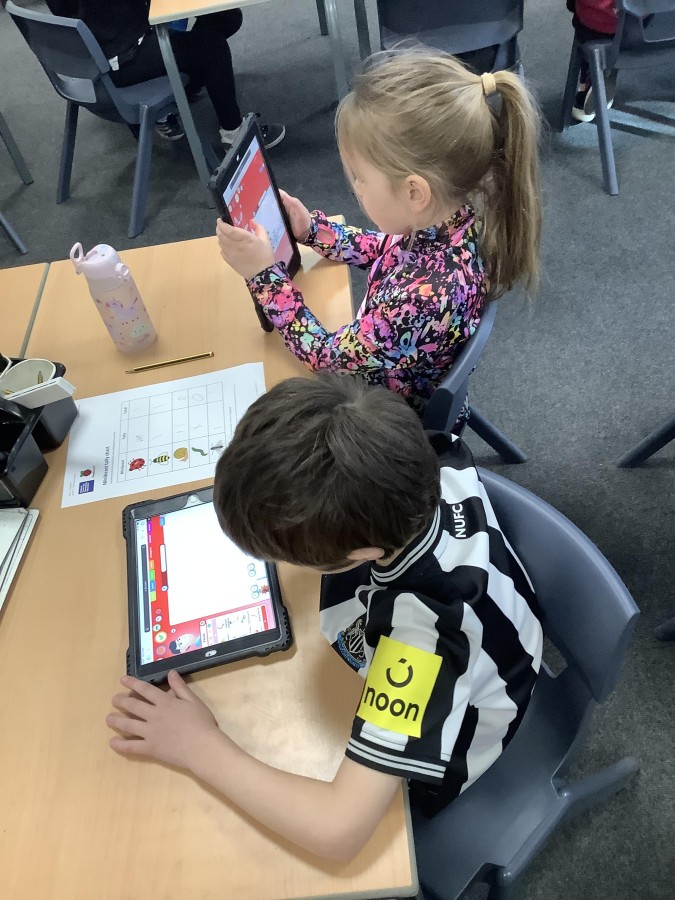
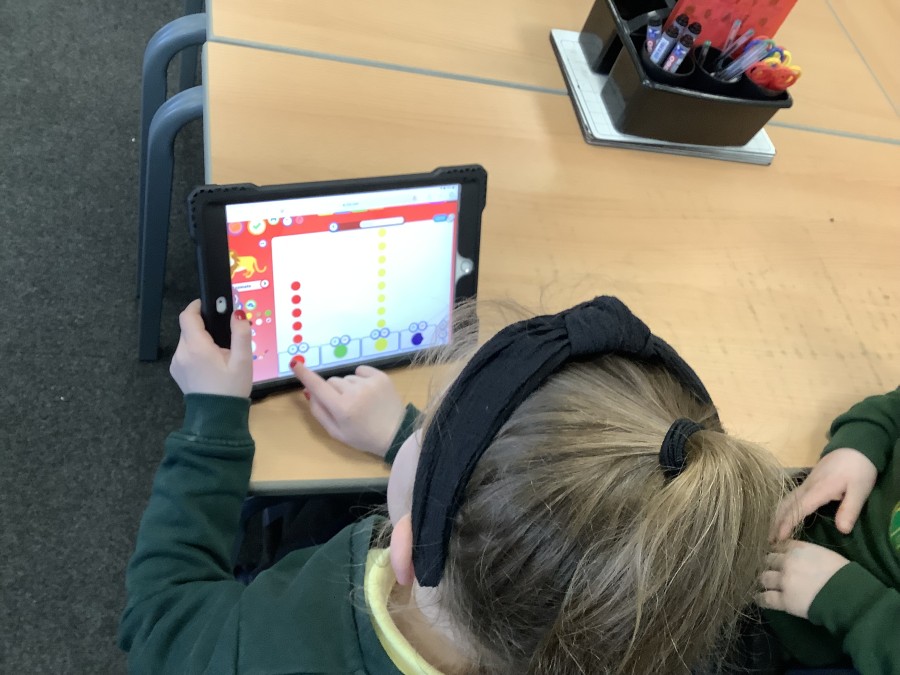
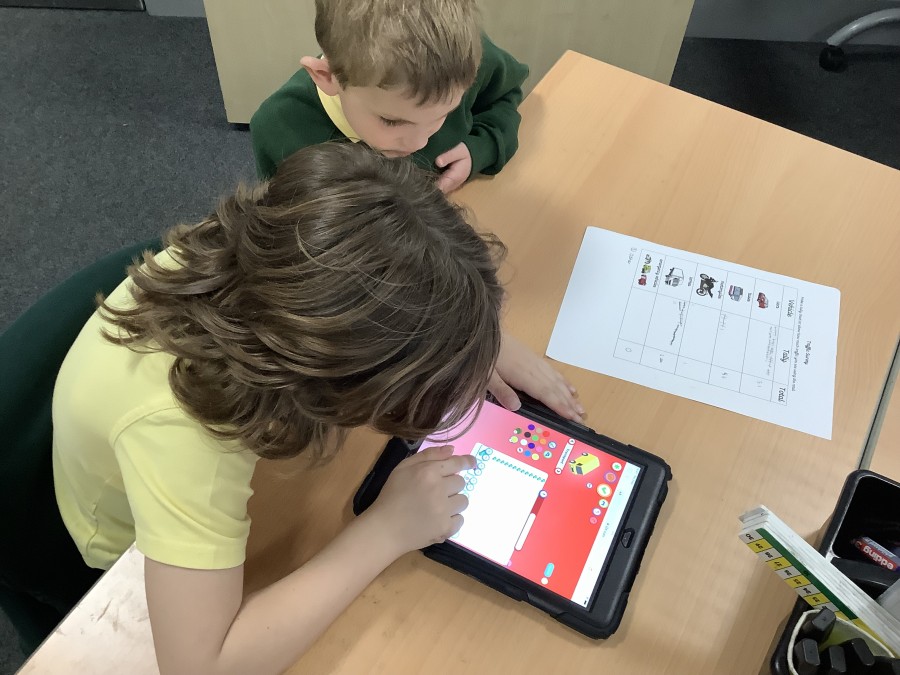
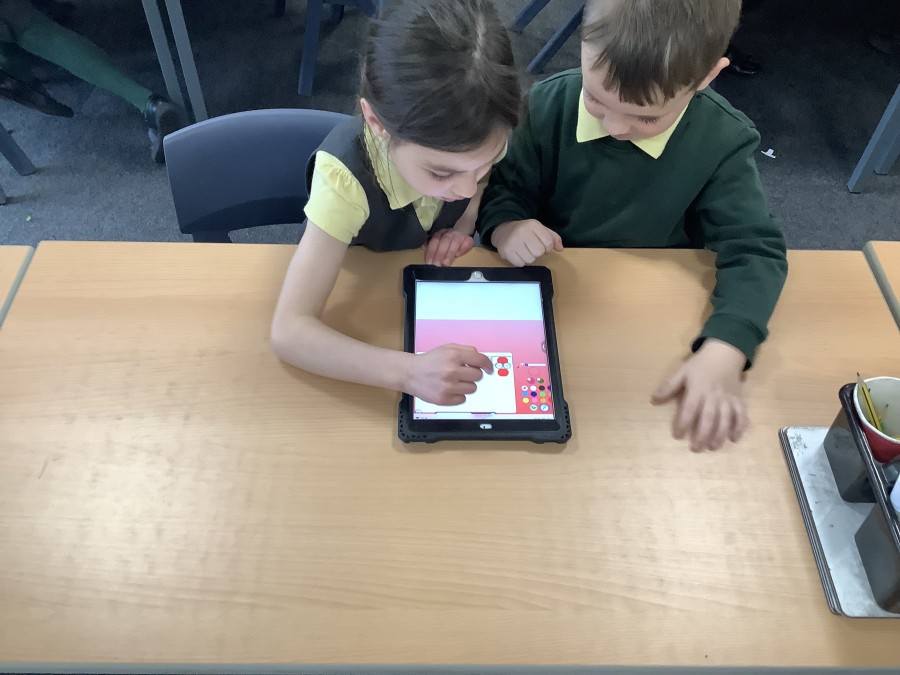
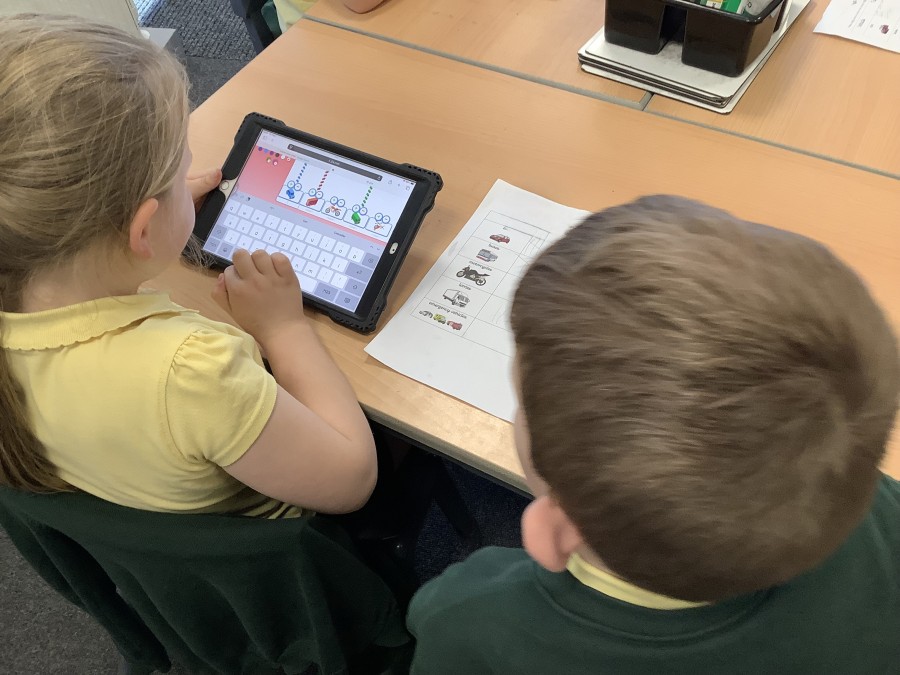
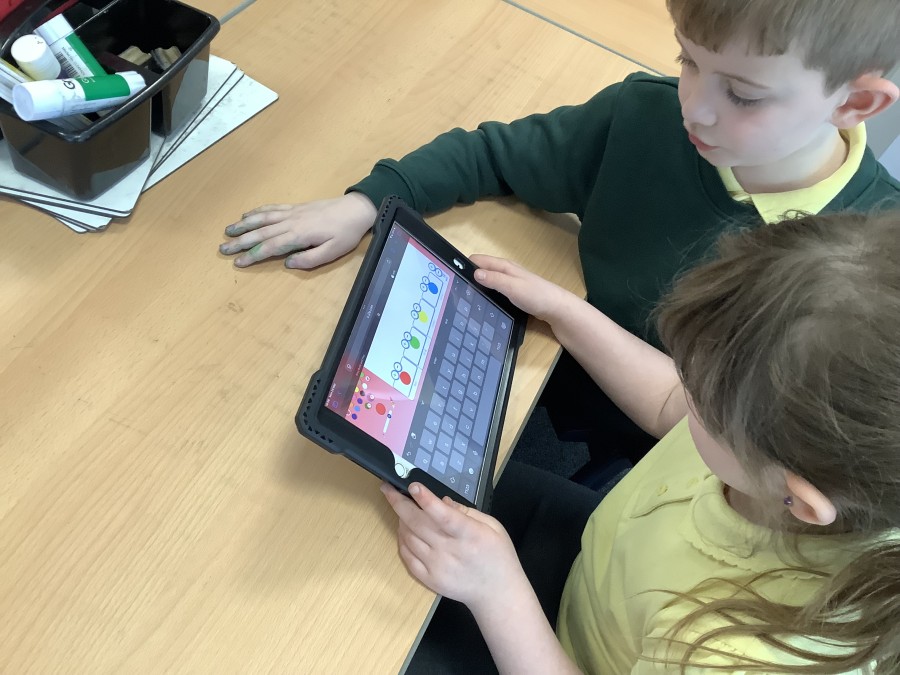
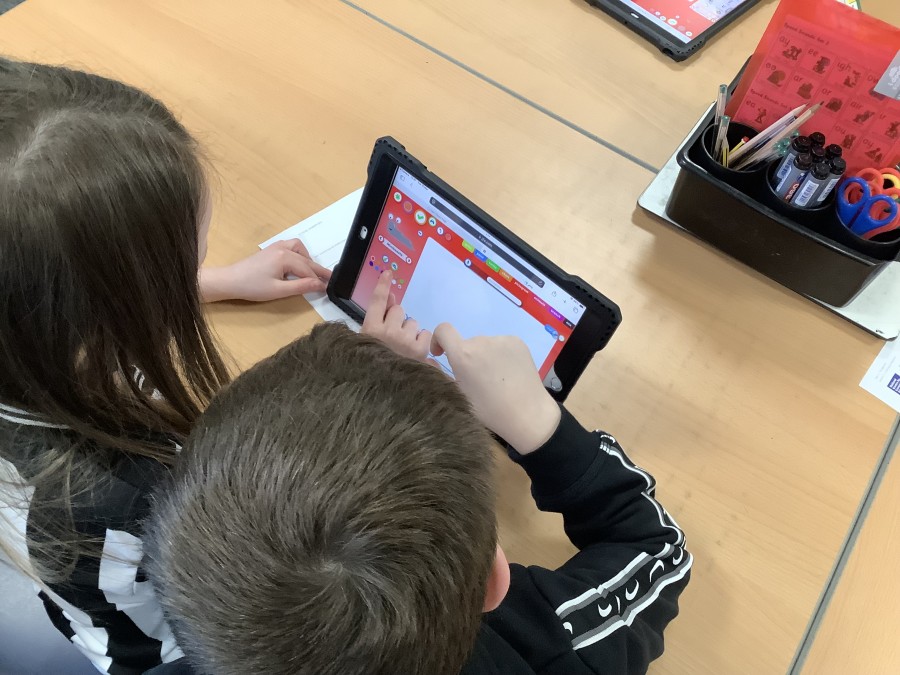
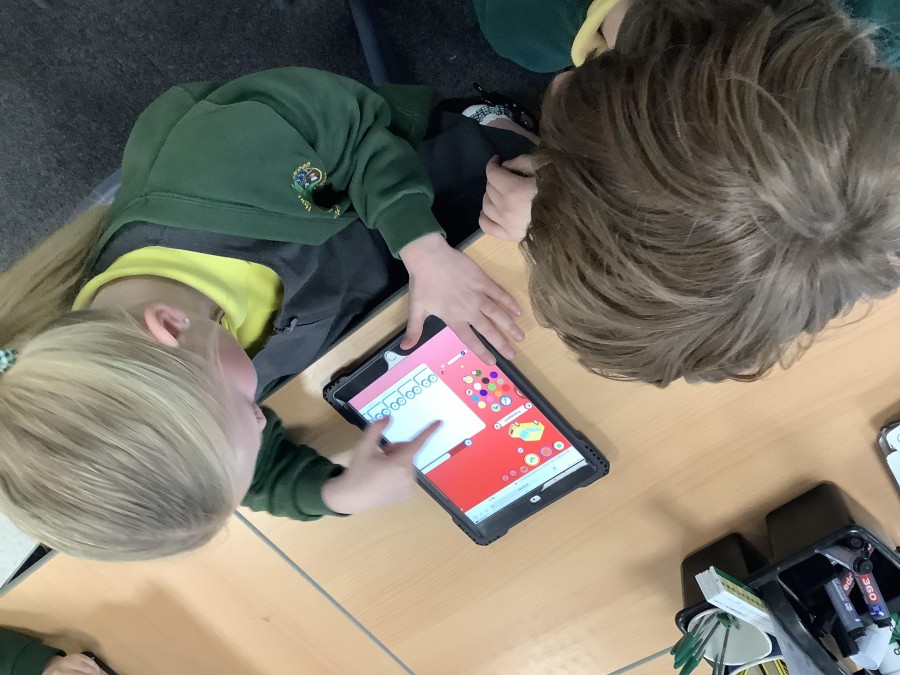
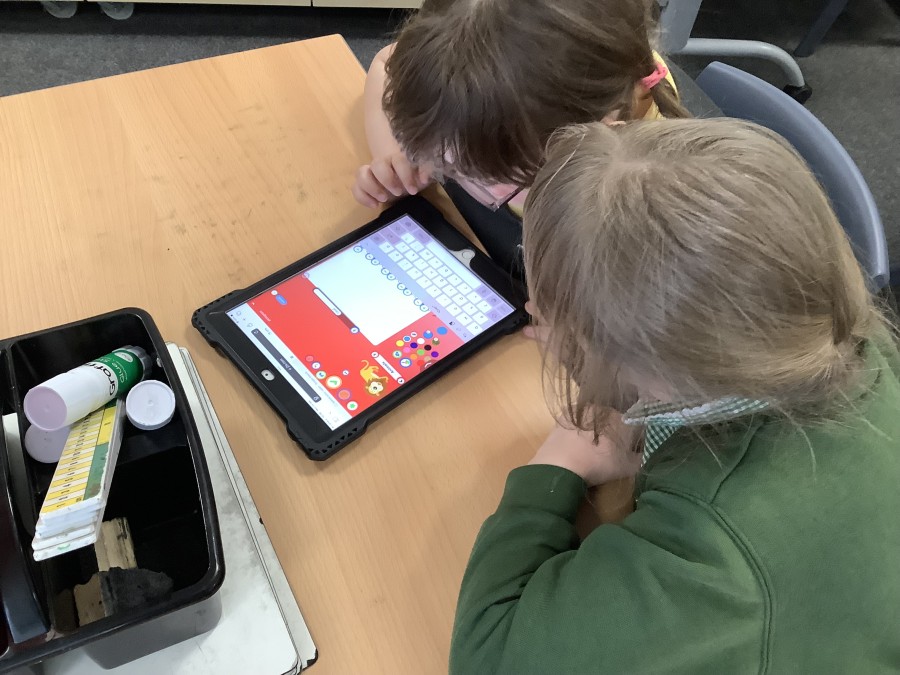
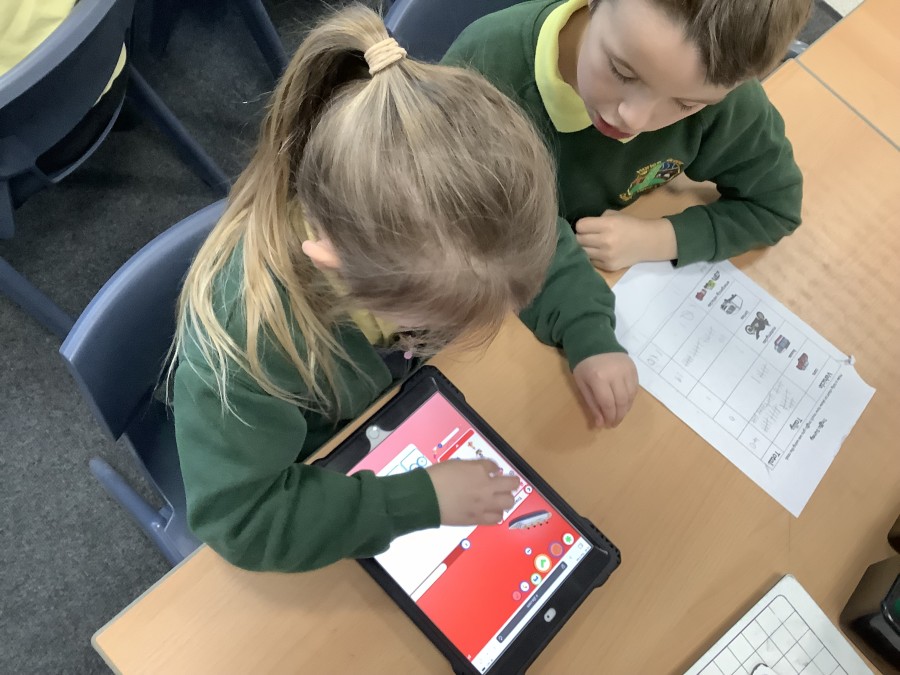
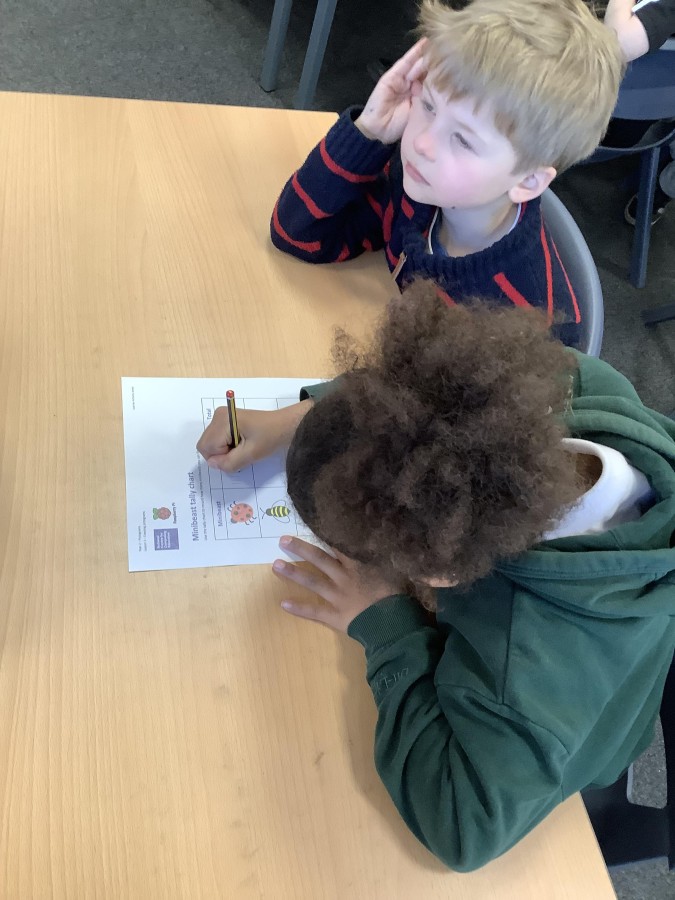
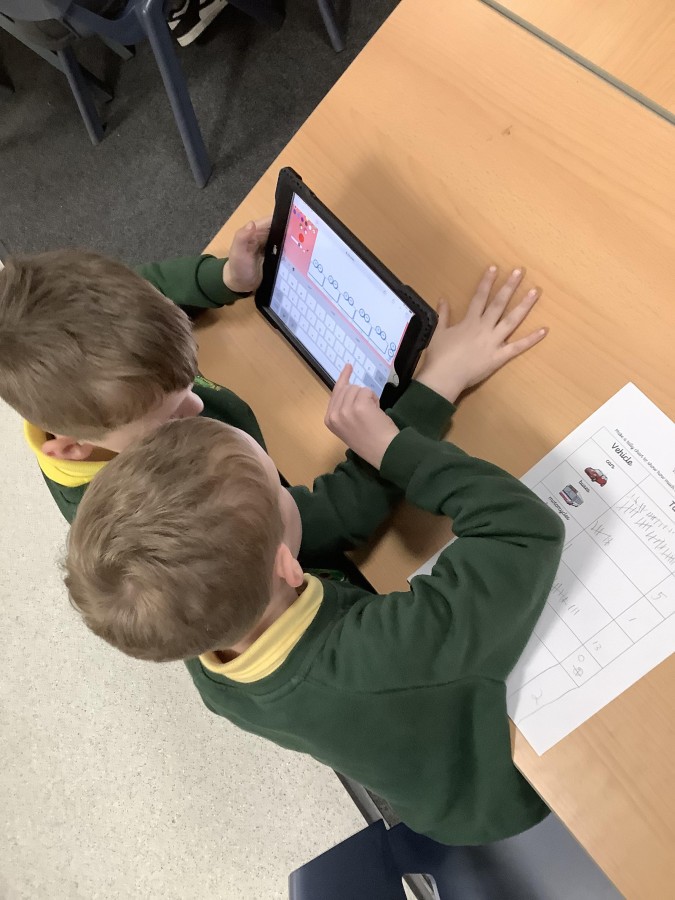
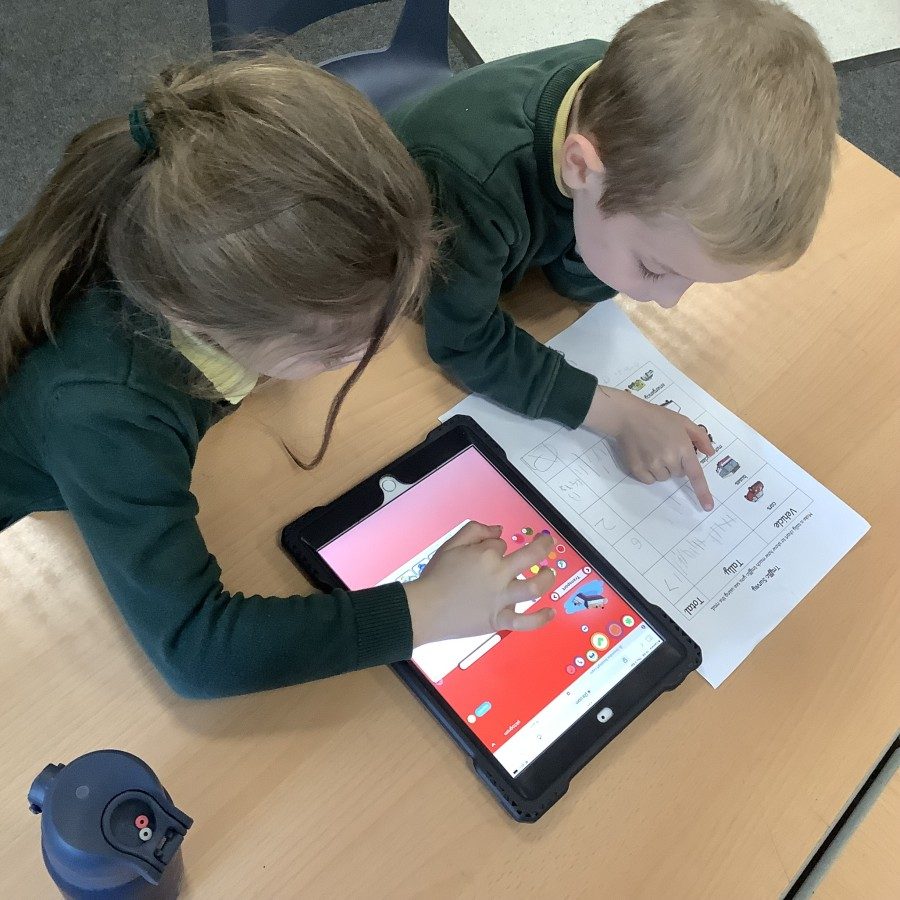
First, the boys and girls learnt how to create a tally. They found out that a tally chart was a useful way to collect data quickly and accurately. After that, the children tried making pictograms to represent the data they had collected. They tried drawing by hand and using a computer. They soon discovered that a computer made this process easier because it allowed them to ensure that all of the pictures were identical in size and shape.
Next, the children used their skills to create pictograms showing their favourite colours and favourite school subjects. They worked together to collect the data and record it as a tally before creating their pictograms. They thought carefully about how they could draw symbols to represent each subject and added labels to their pictograms too.
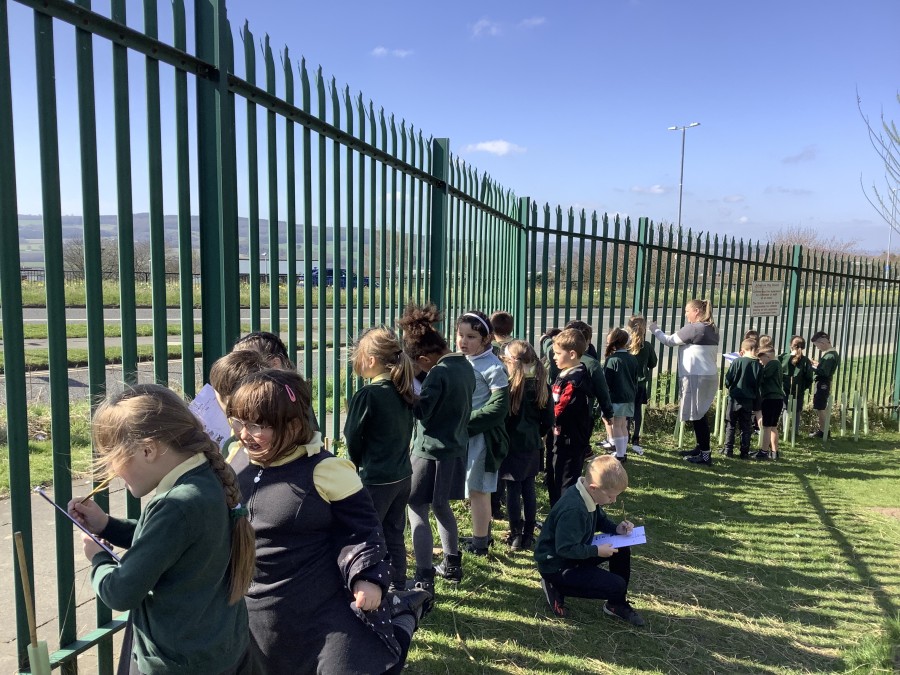
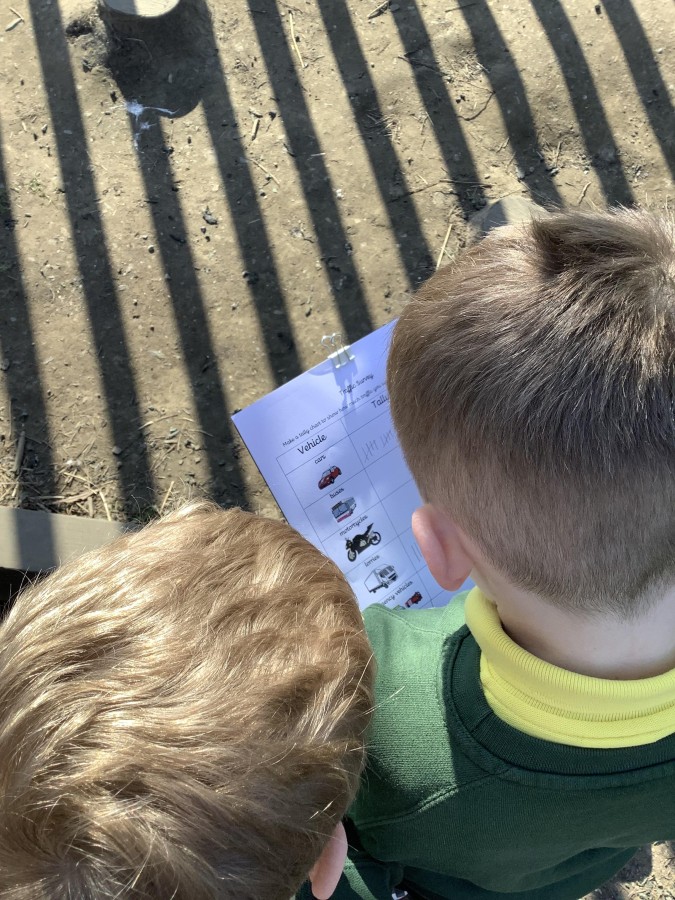
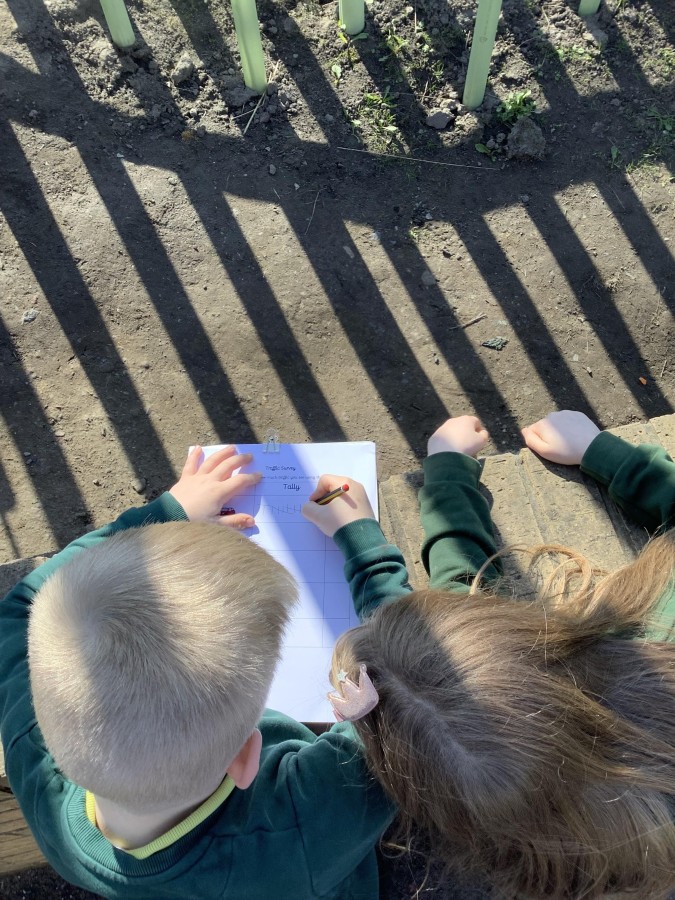
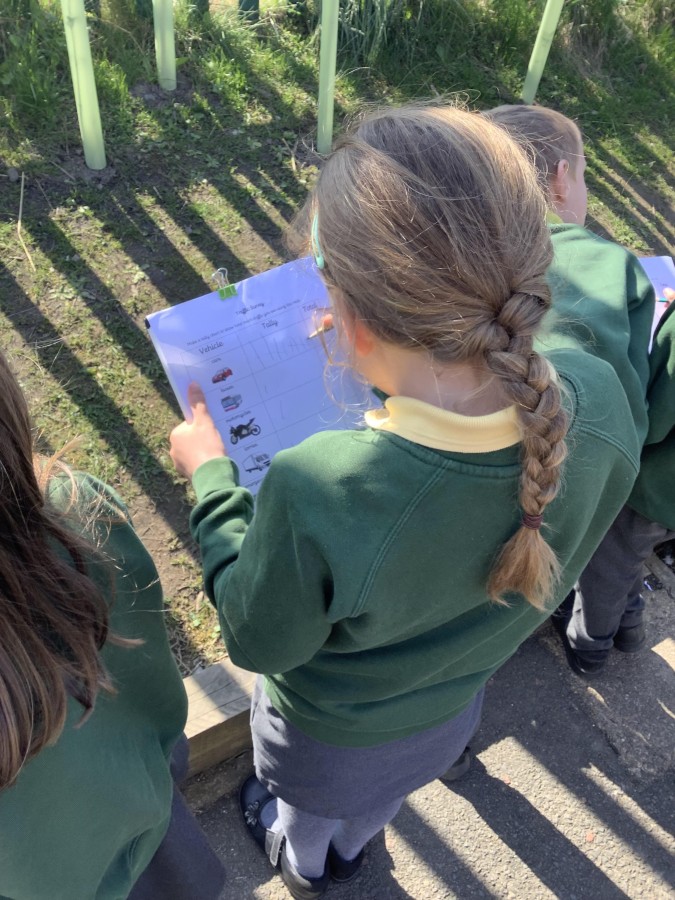
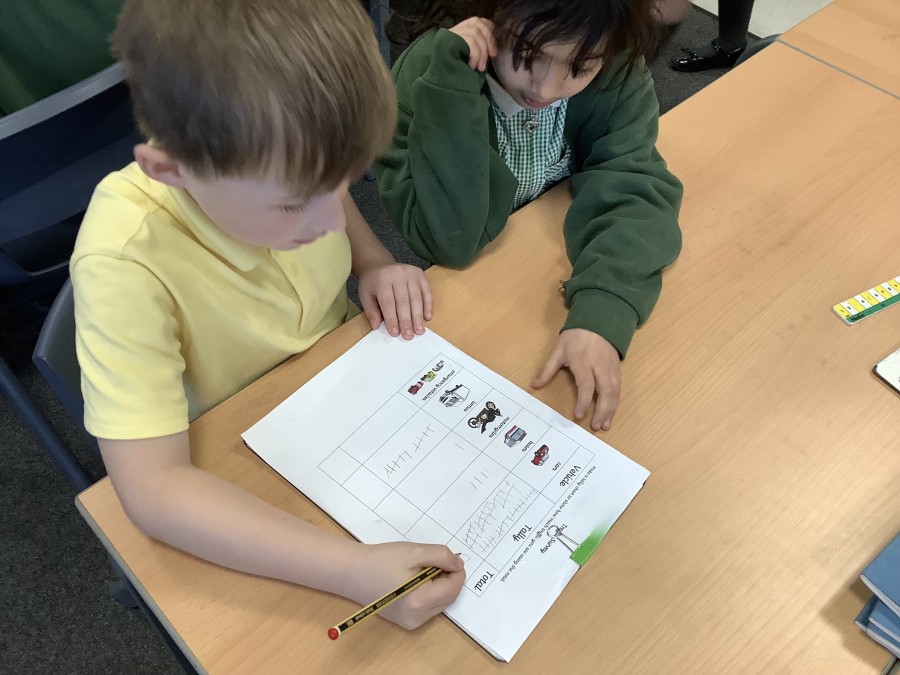
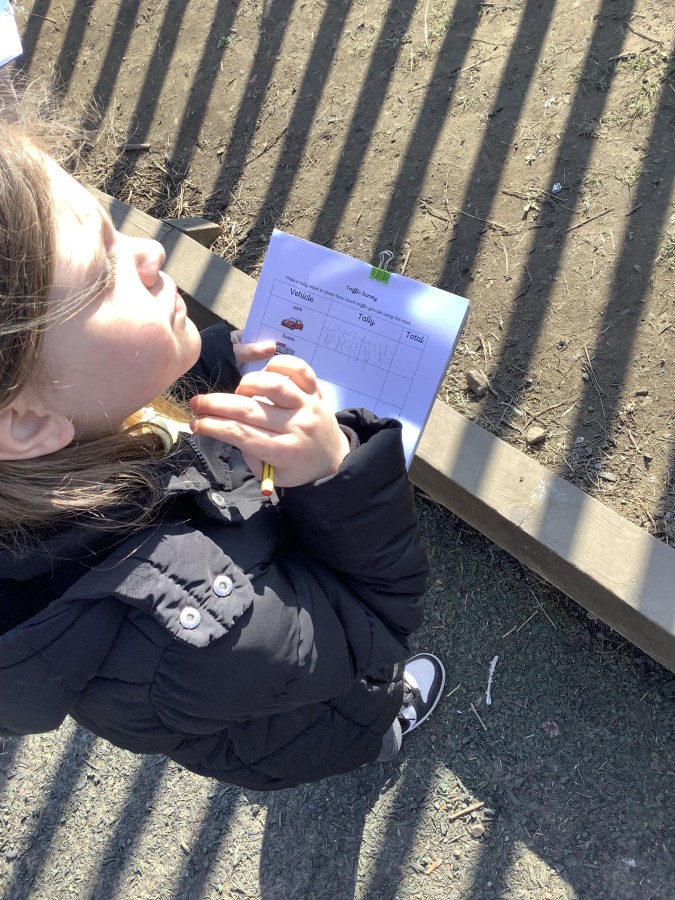
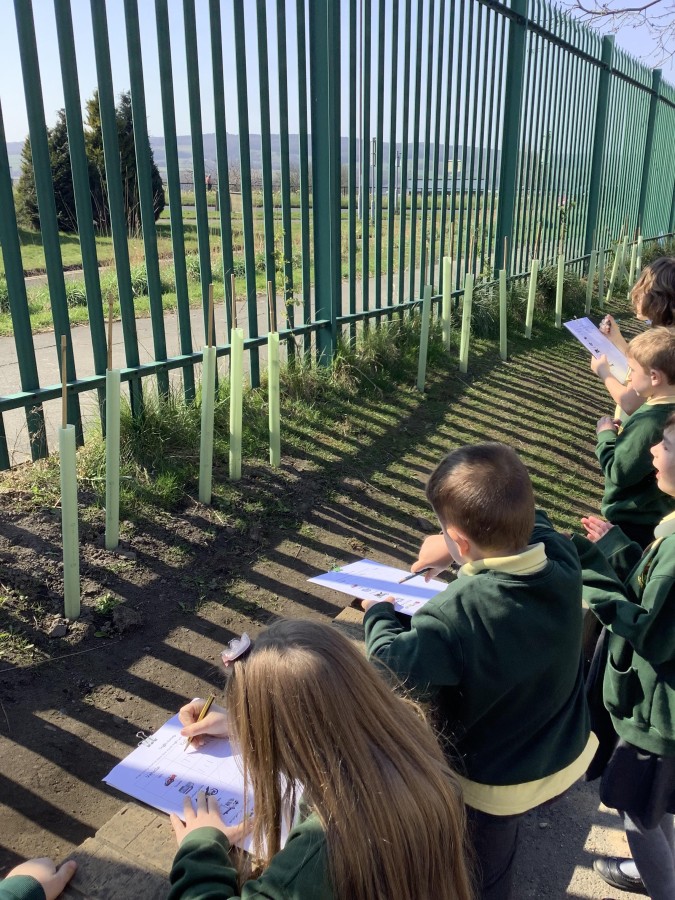
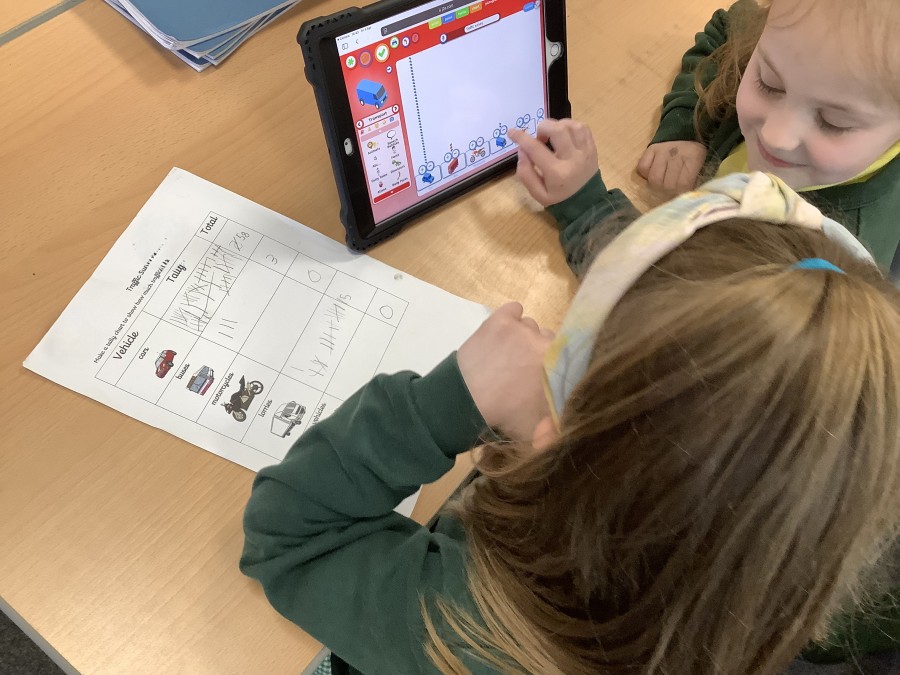
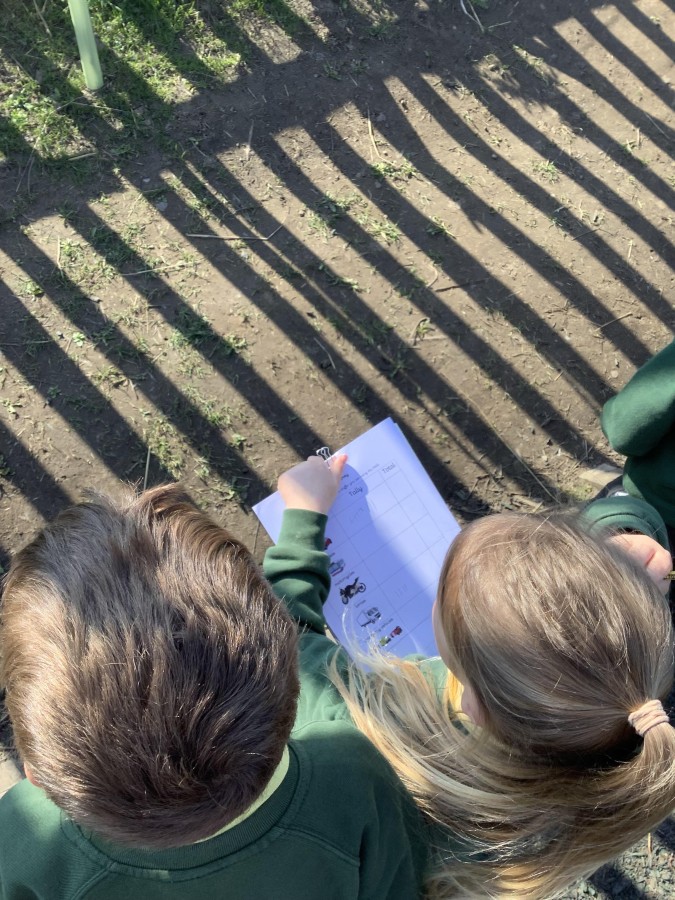
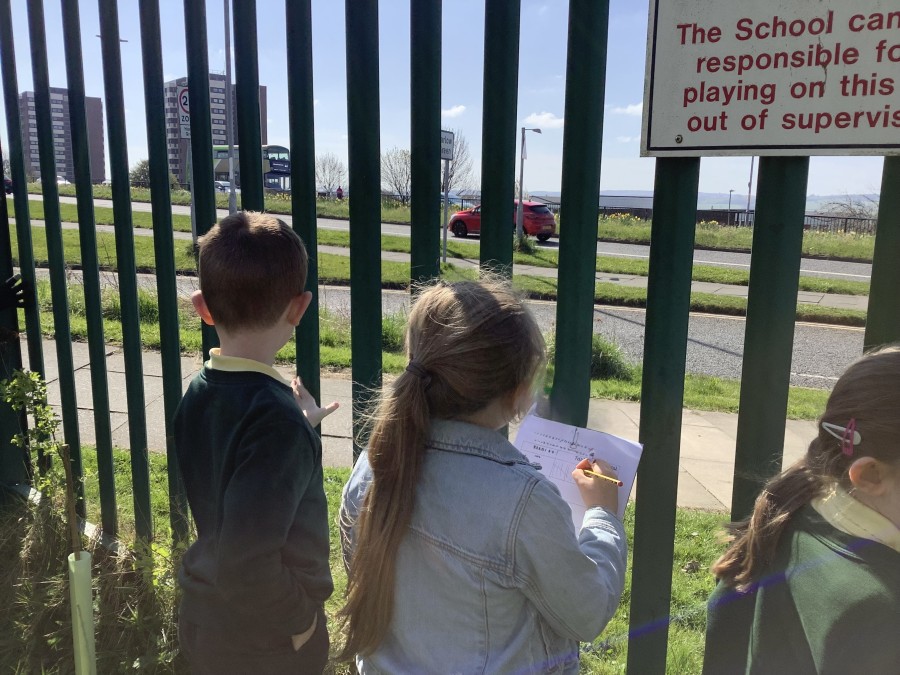
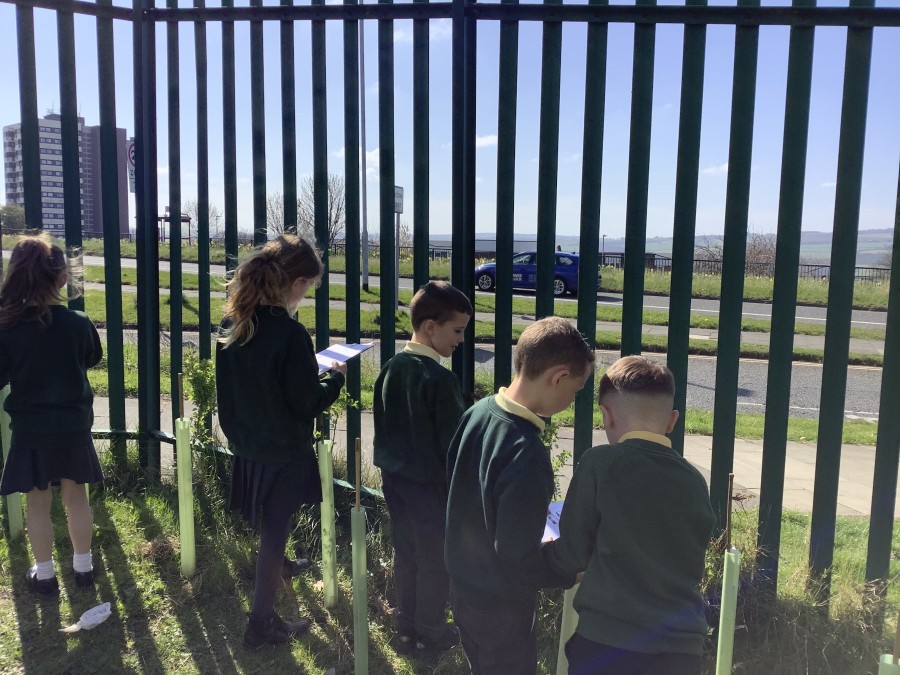
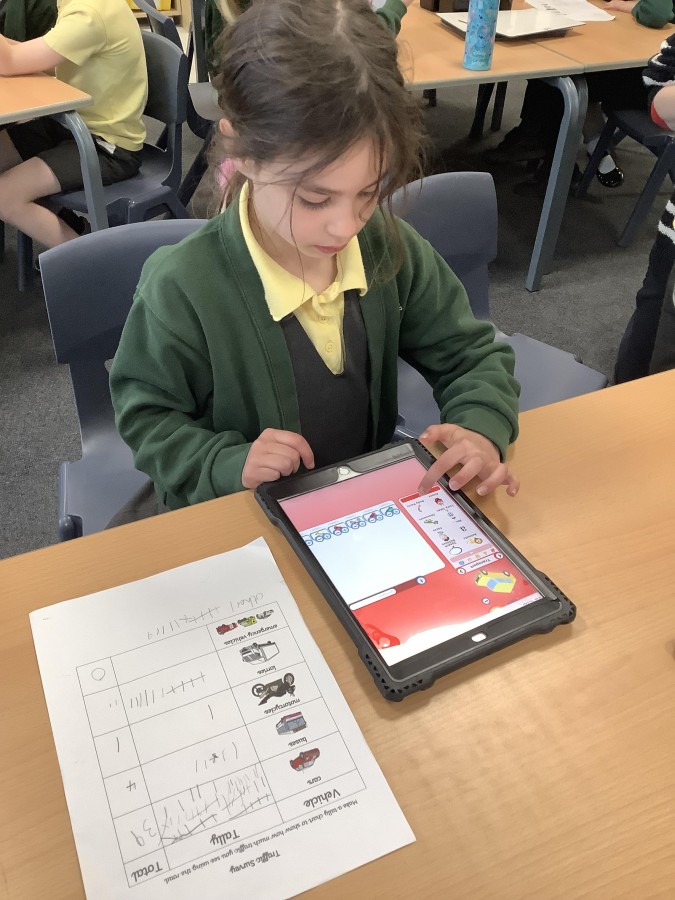
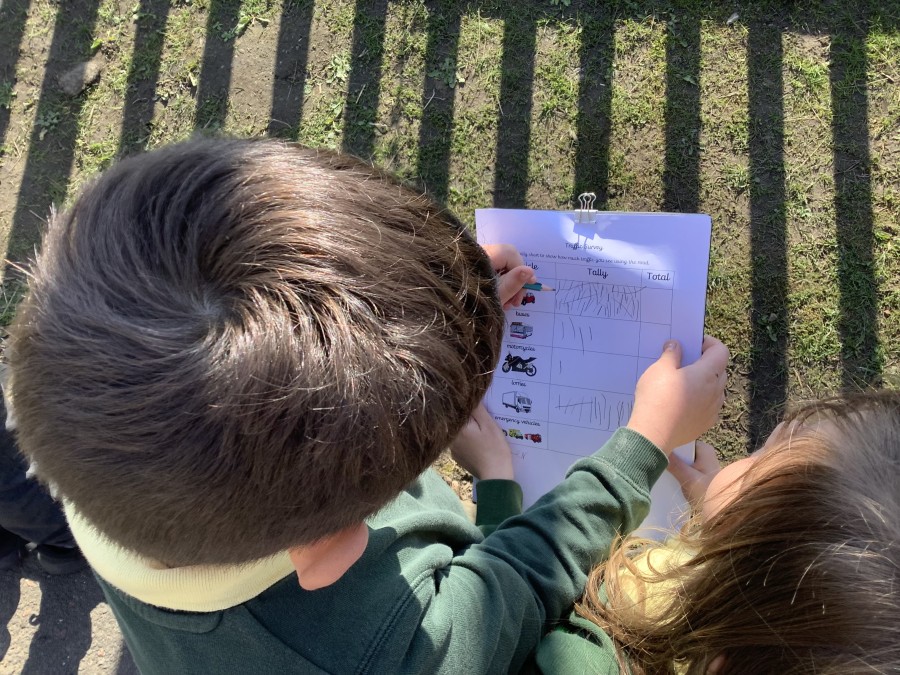
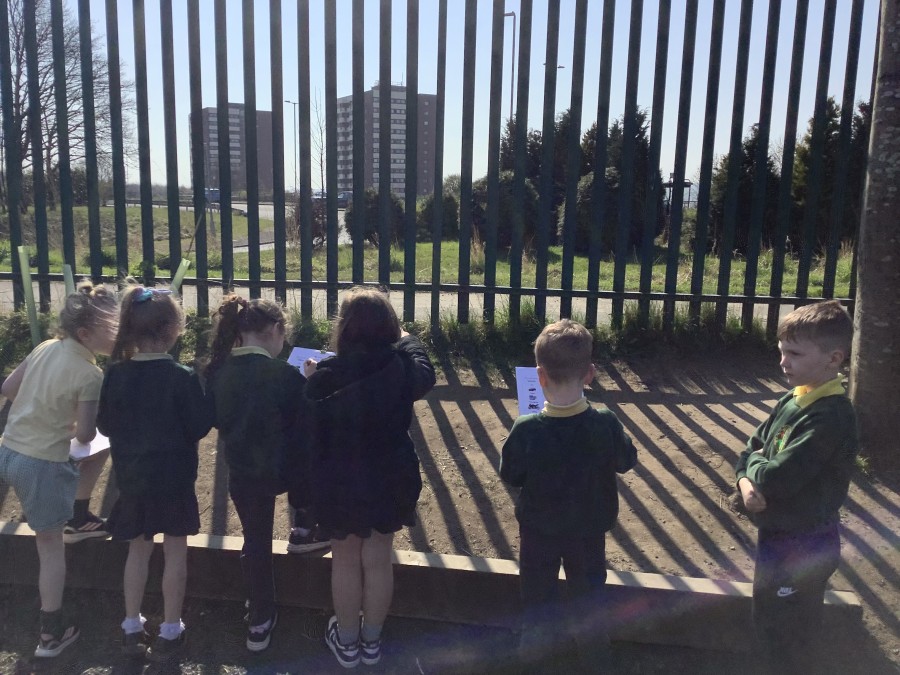
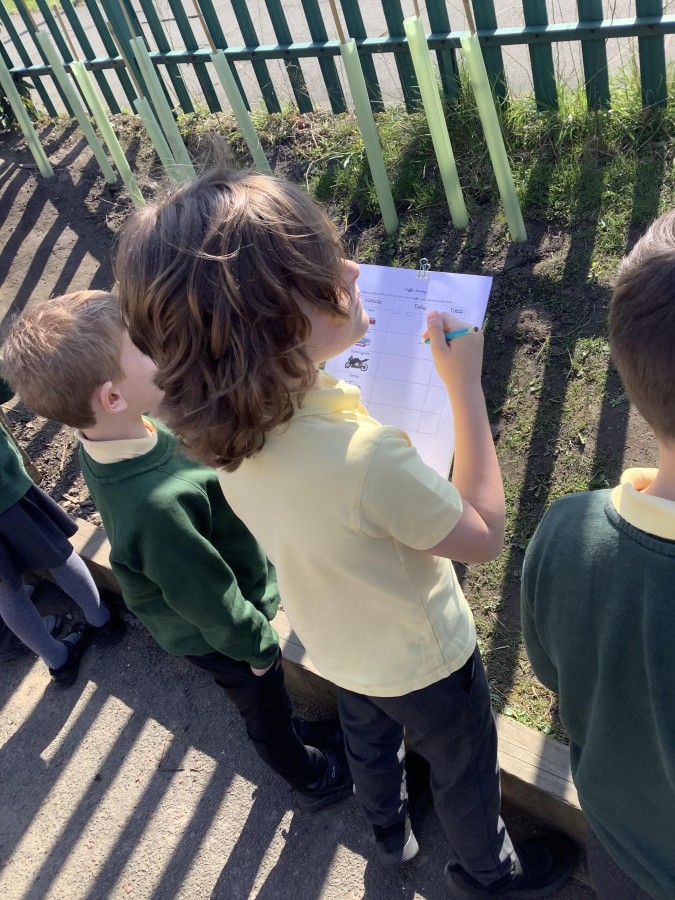
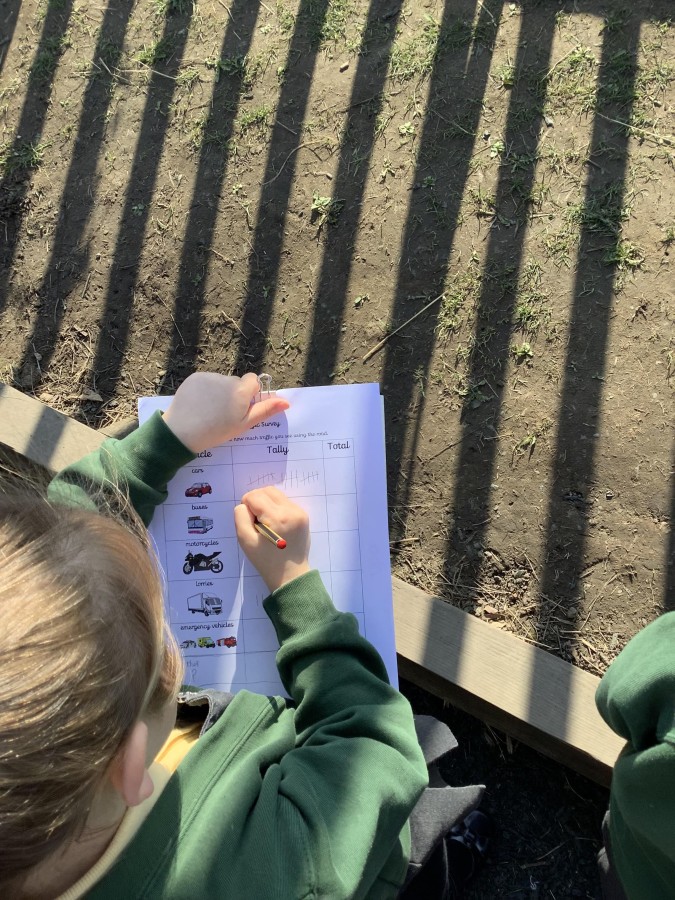
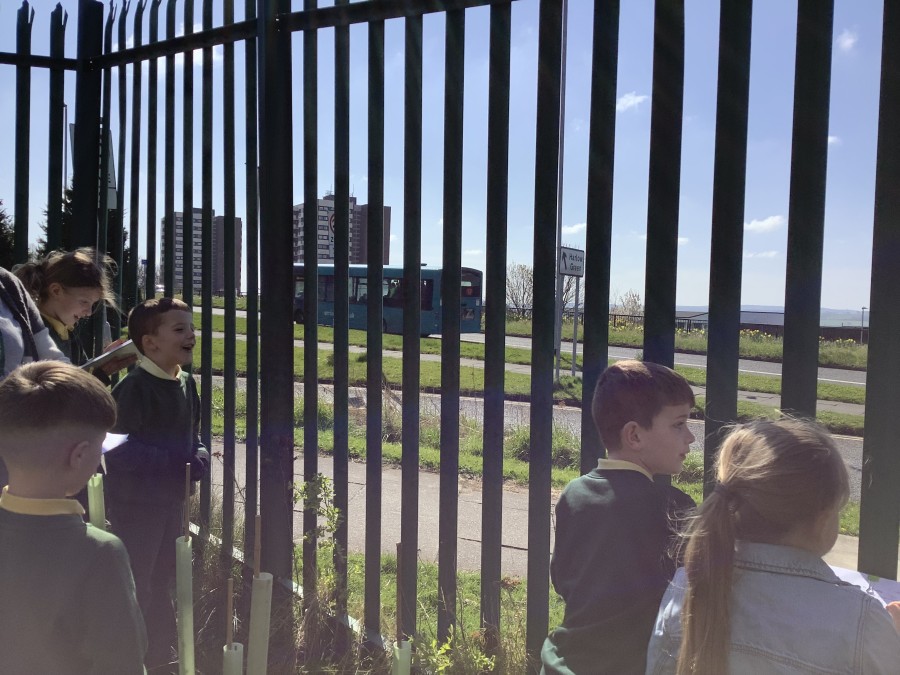
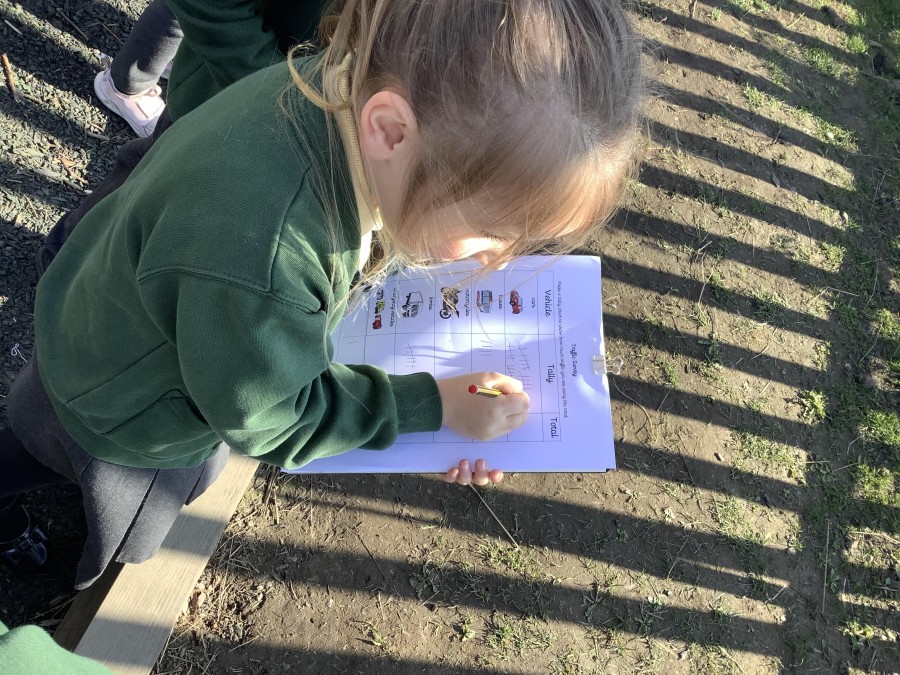
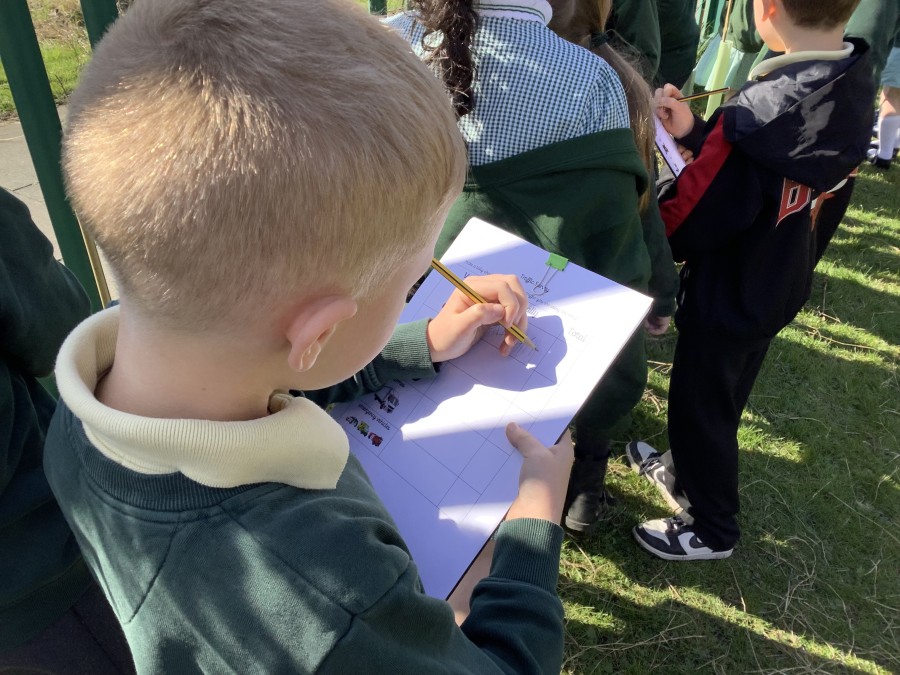
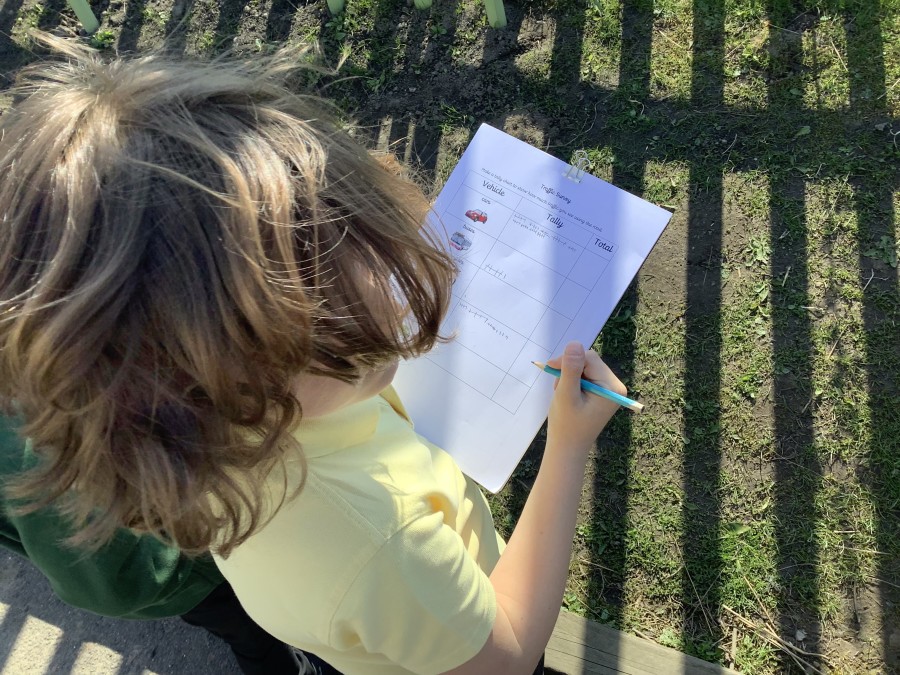
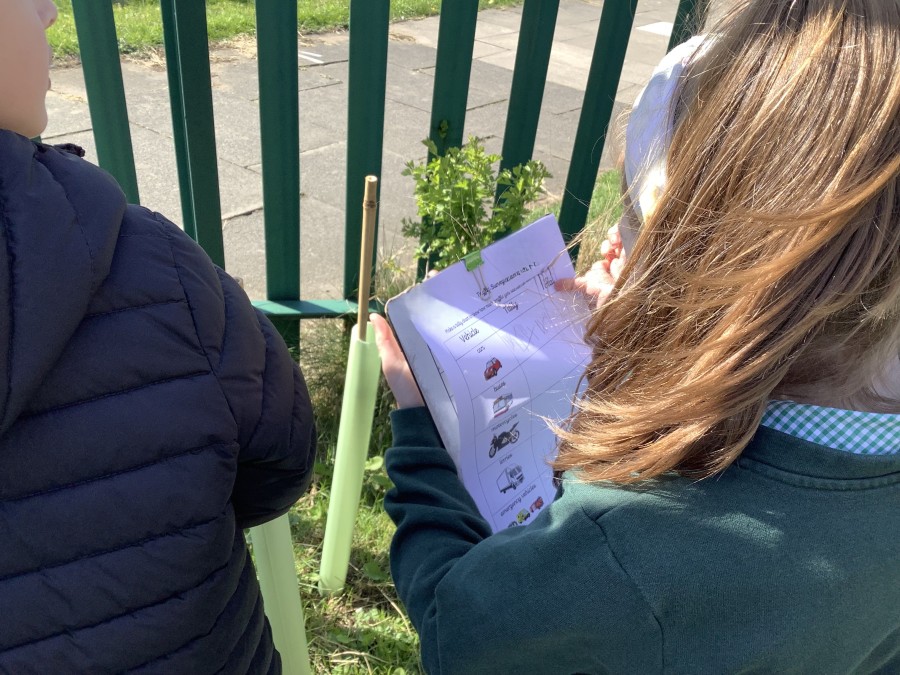
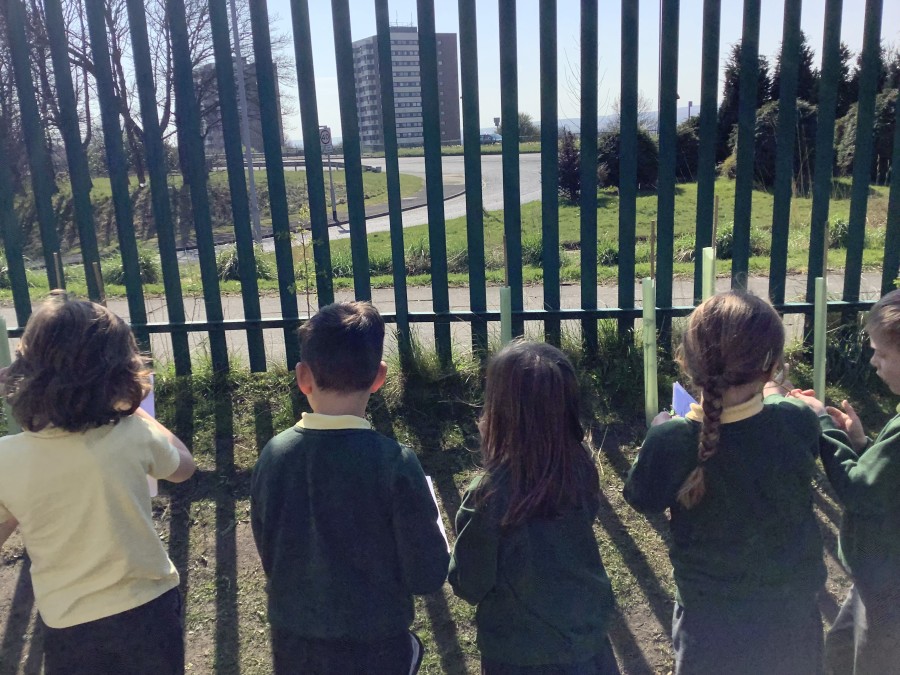
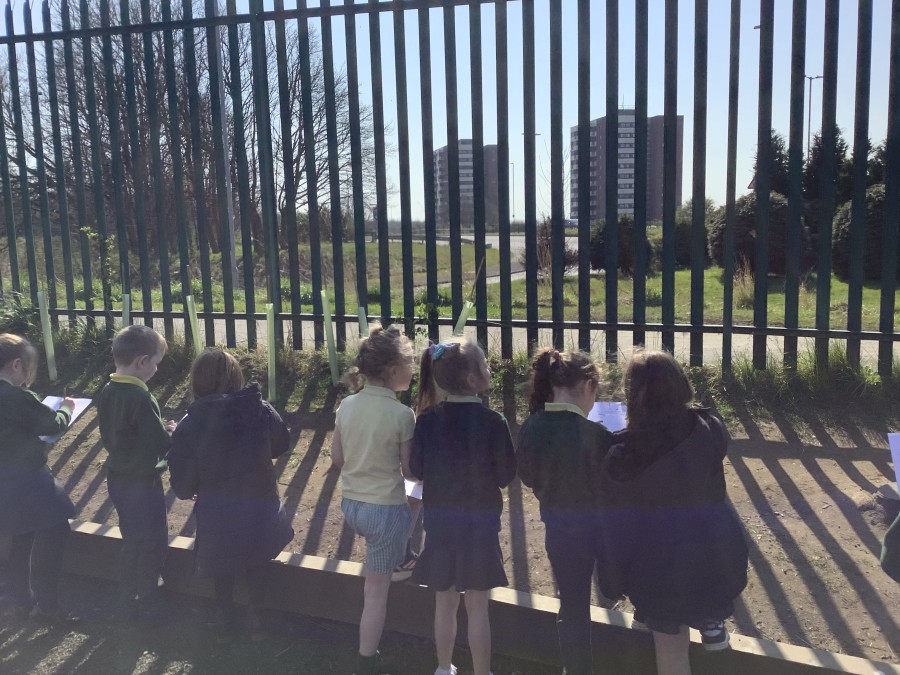
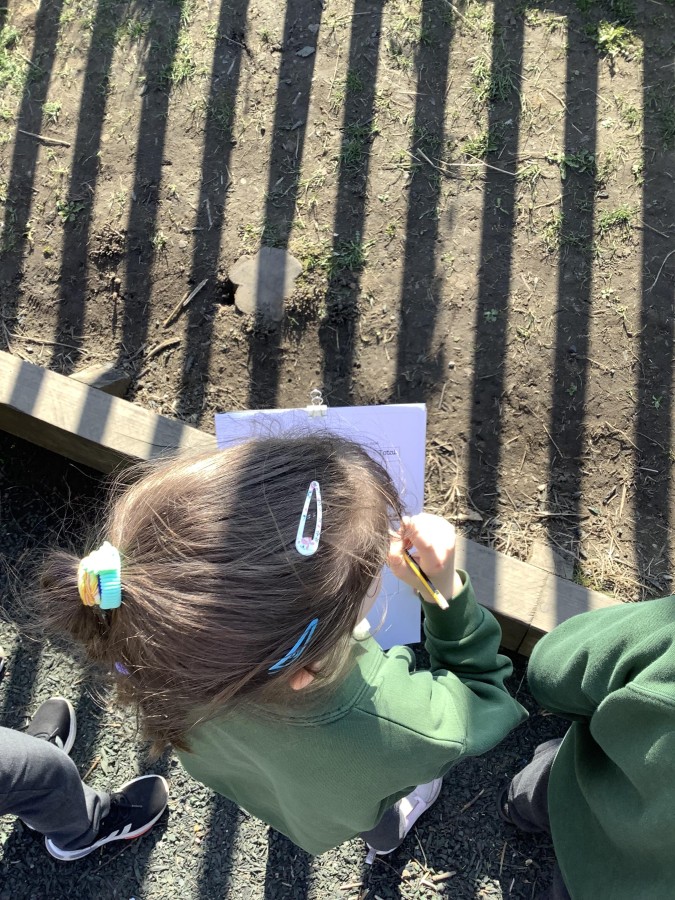
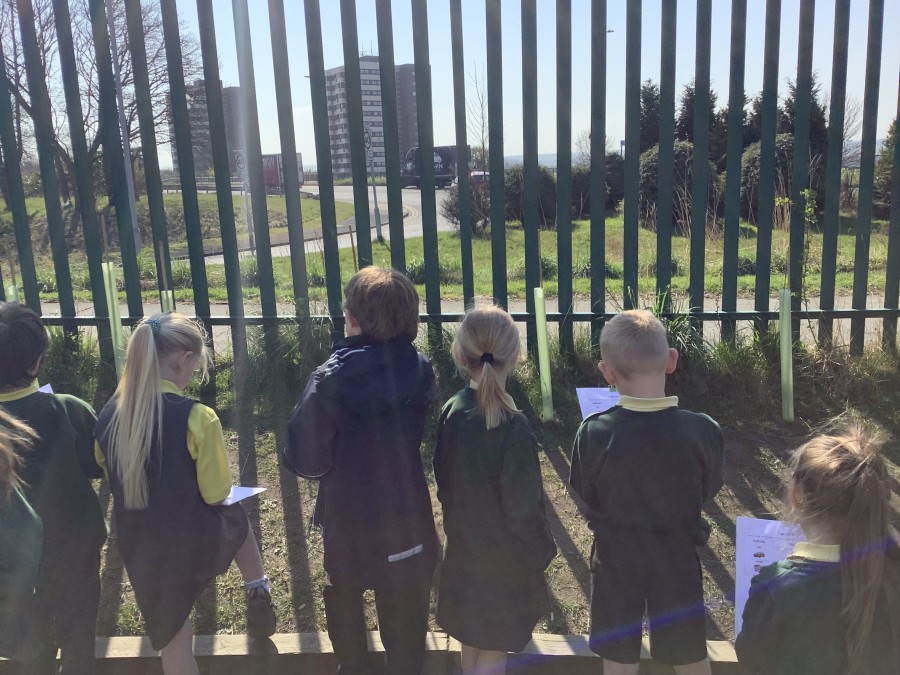
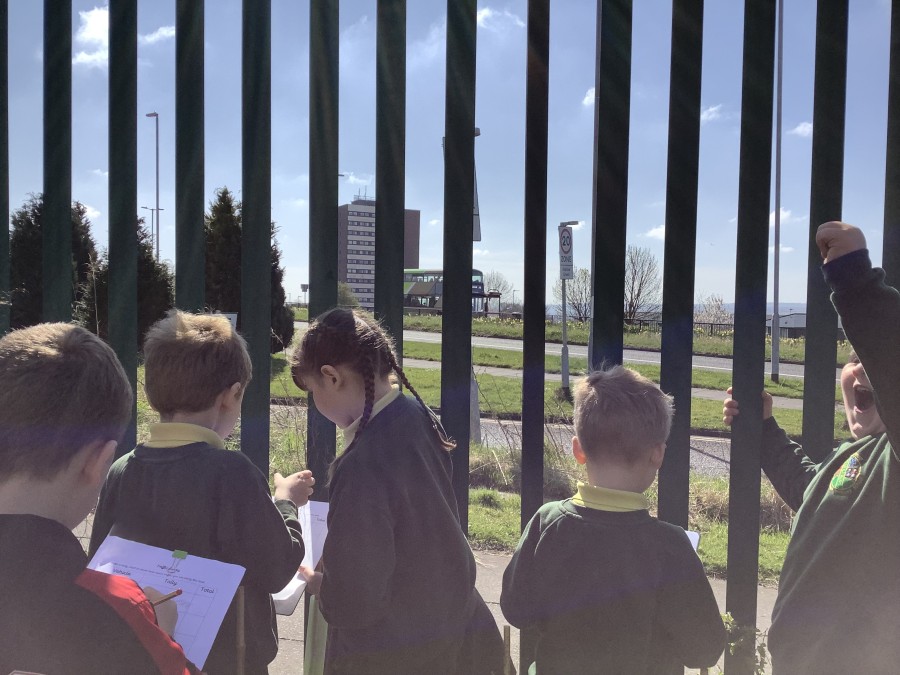
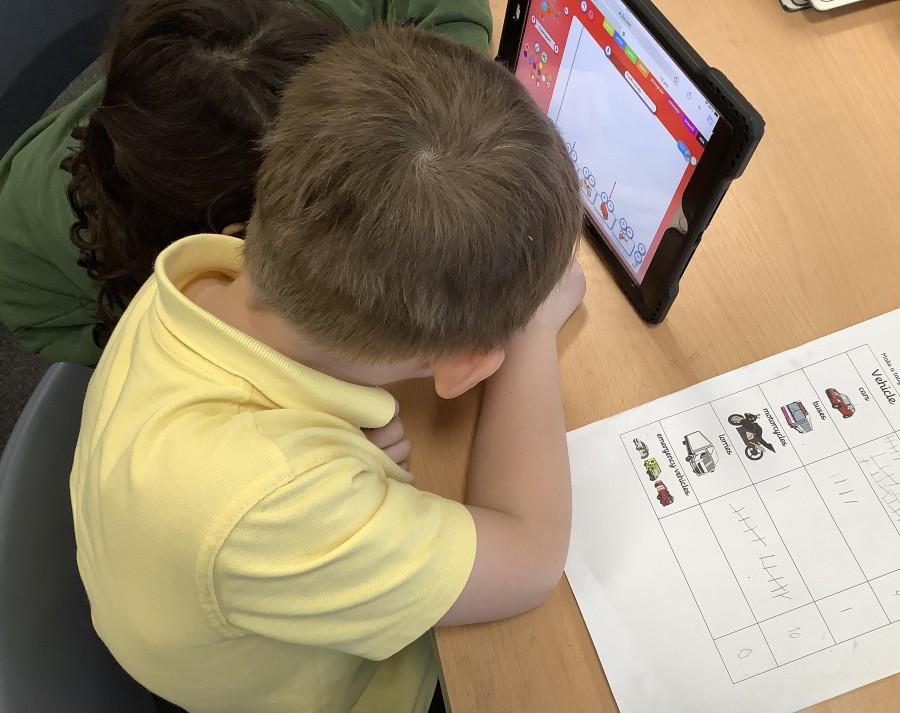
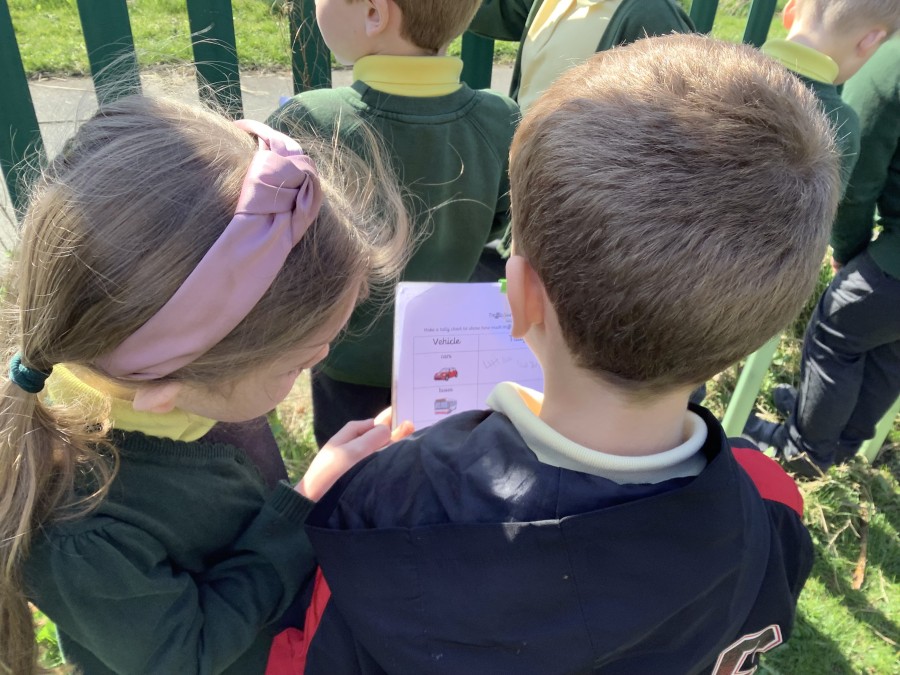
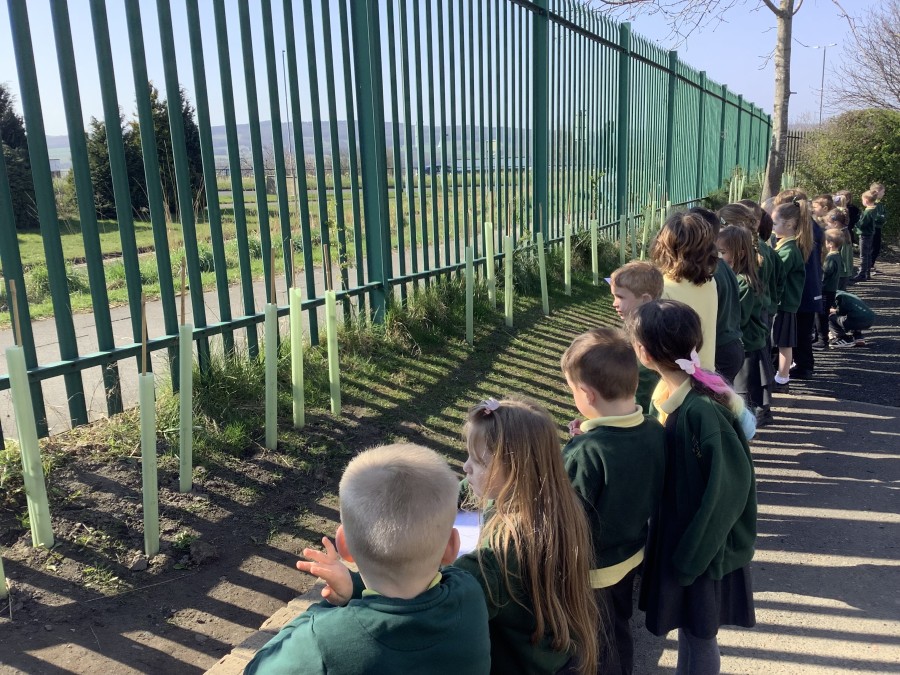
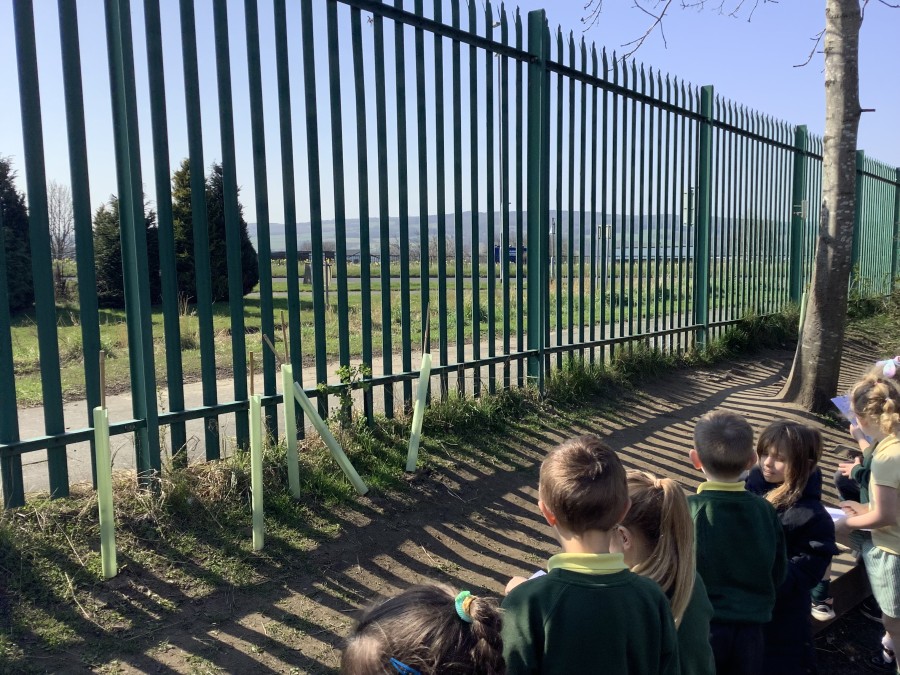
Finally, the boys and girls were given a challenge to test their new skills. They were asked to collect and record data to answer a geographical question – What types of vehicles drive past our school?
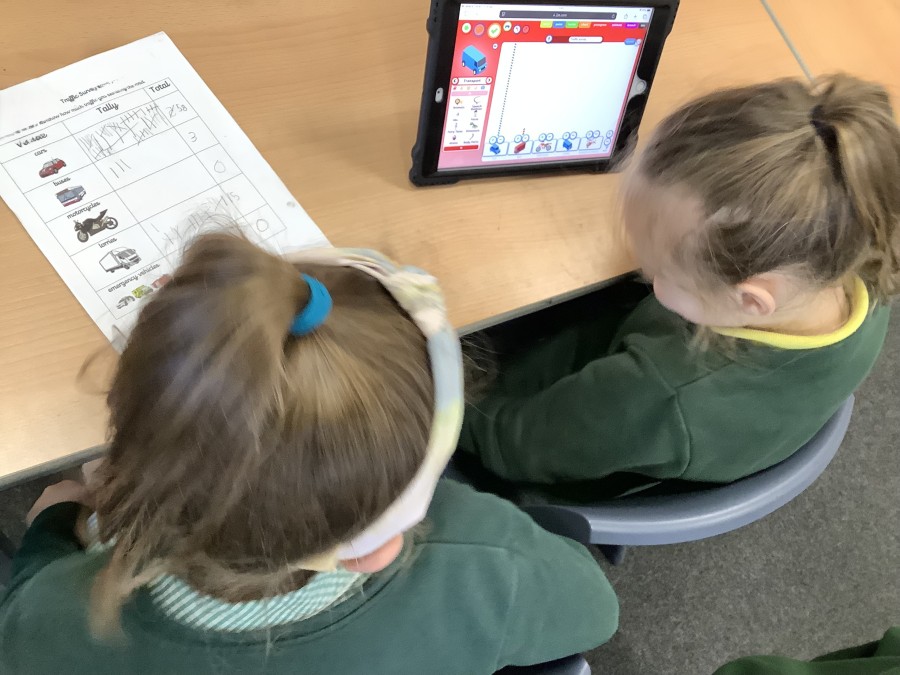
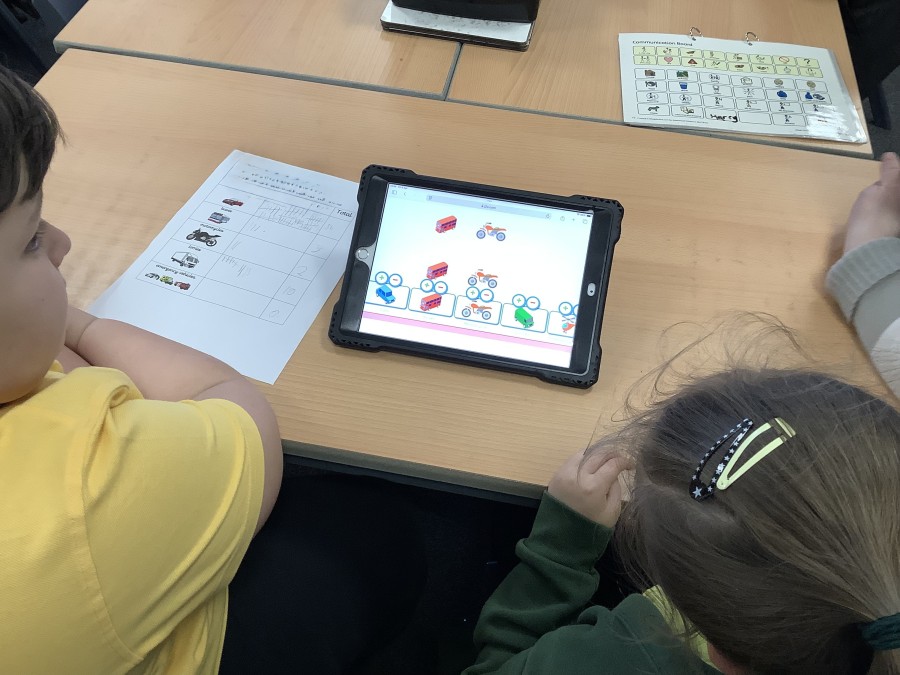
The children kept a tally of the vehicles that passed the school yard over a period of time. Once this was complete they created pictograms to represent their data. These were then used to help identify which vehicles drove past our school the most.
Article 28: We all have the right to a good quality education