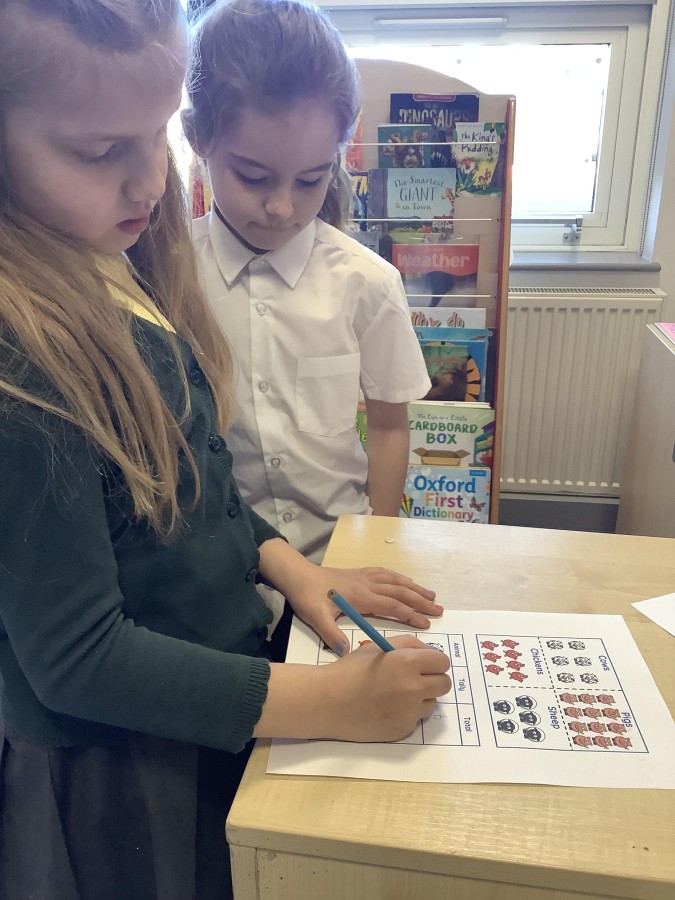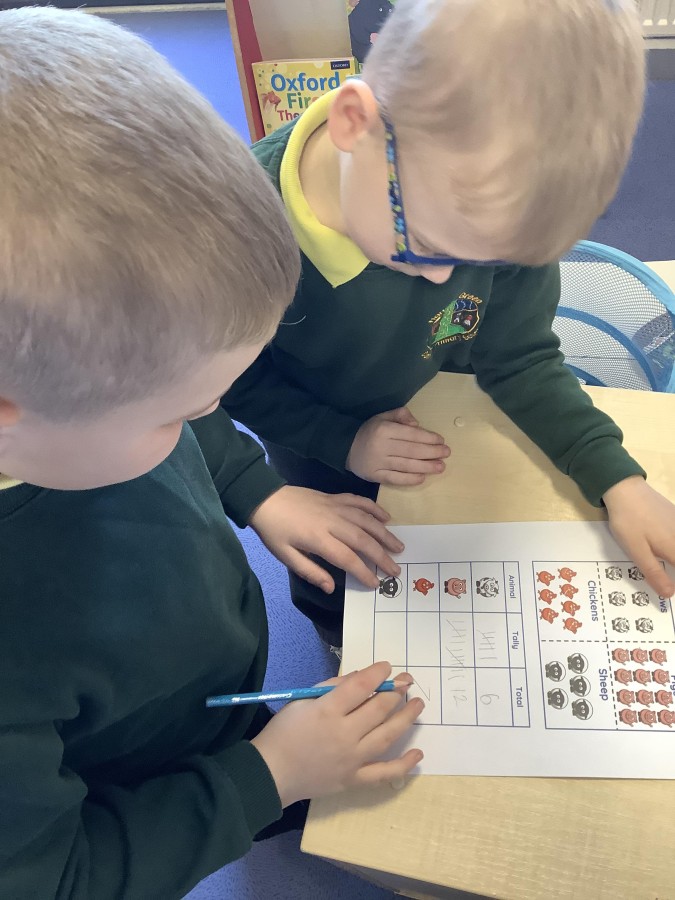
In Computing, Year Two have been learning all about pictograms. To begin, they learned how to use a tally to record a total number of objects. Together, we made a class tally chart to find out what Year Two’s favourite fruit is – strawberries!
Next, the children found out that a tally chart can be used to create a pictogram. Using the data collected, we created a class pictogram to show the children’s favourite colours.
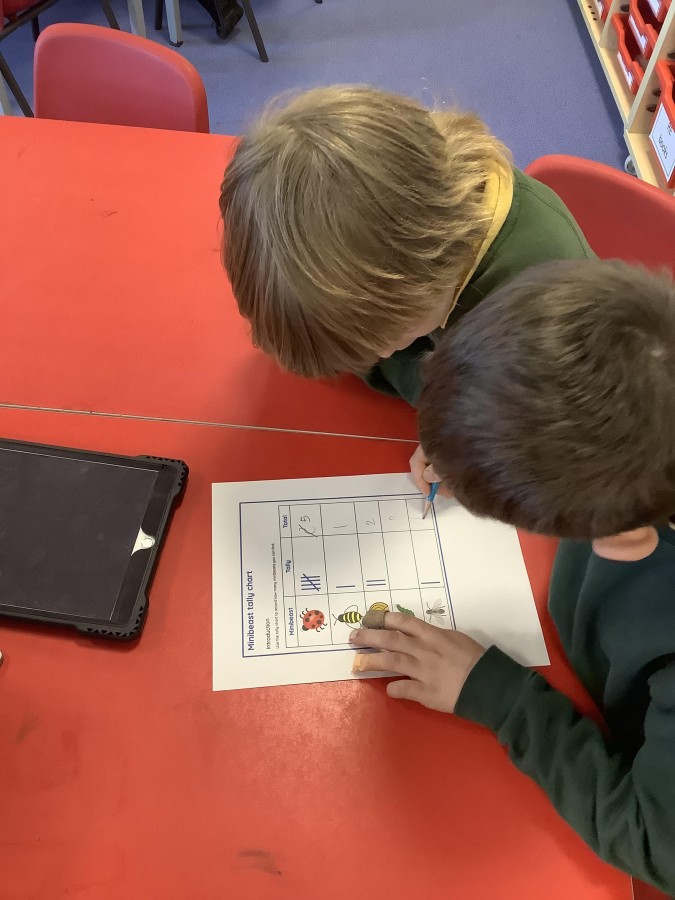
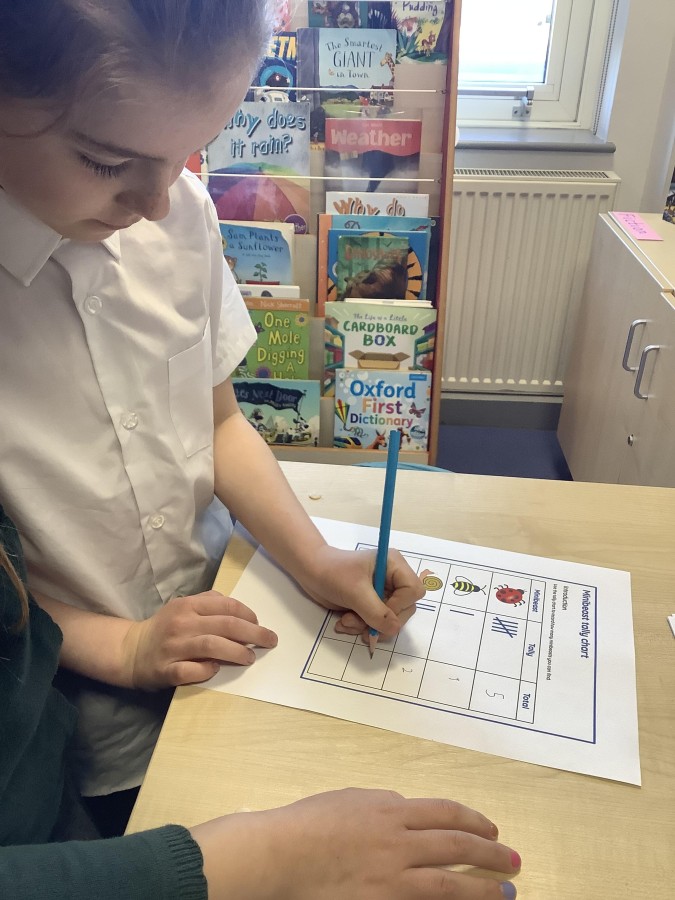
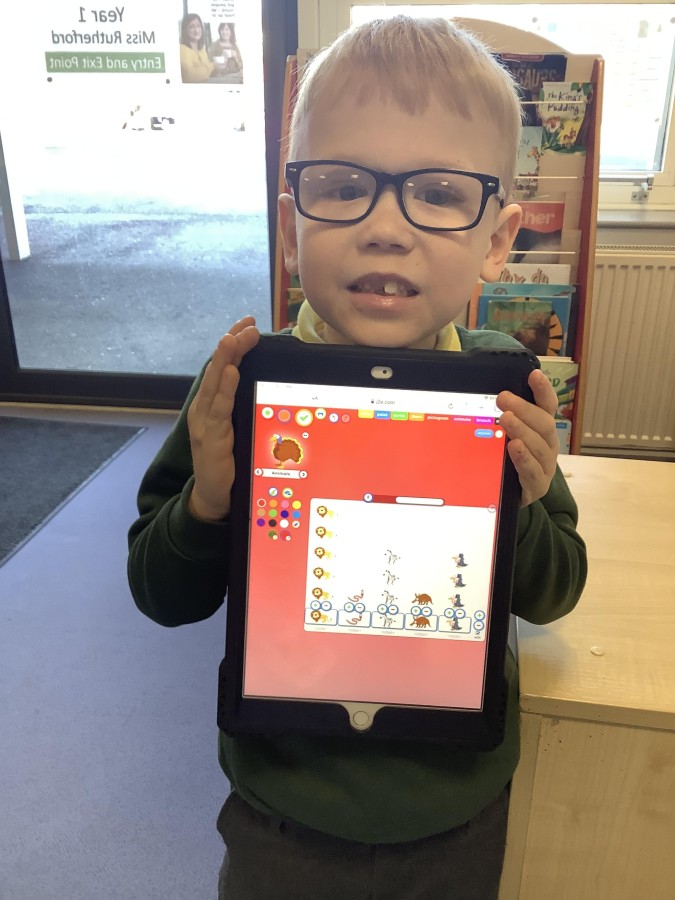
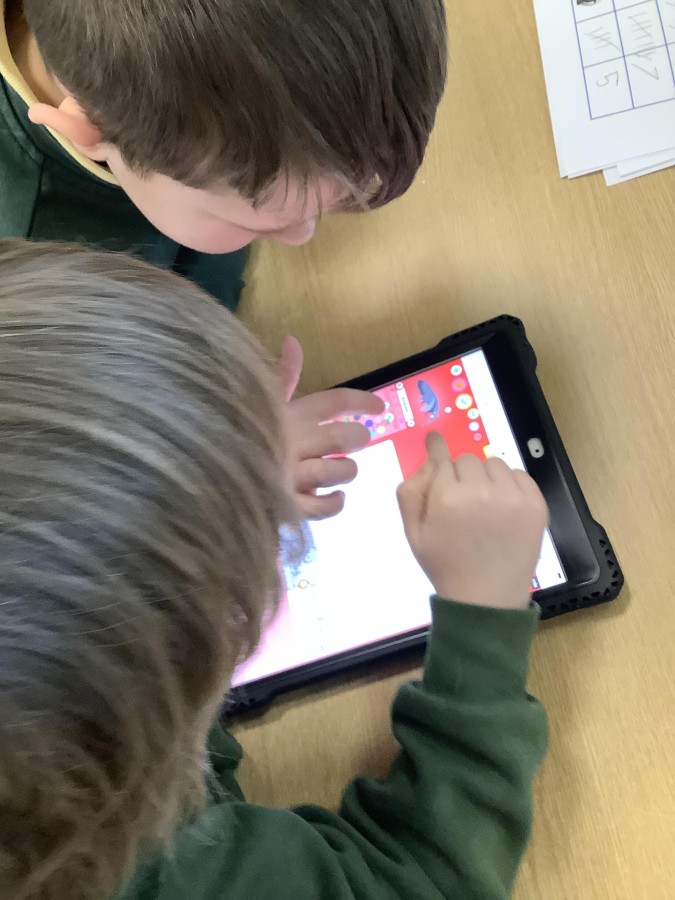
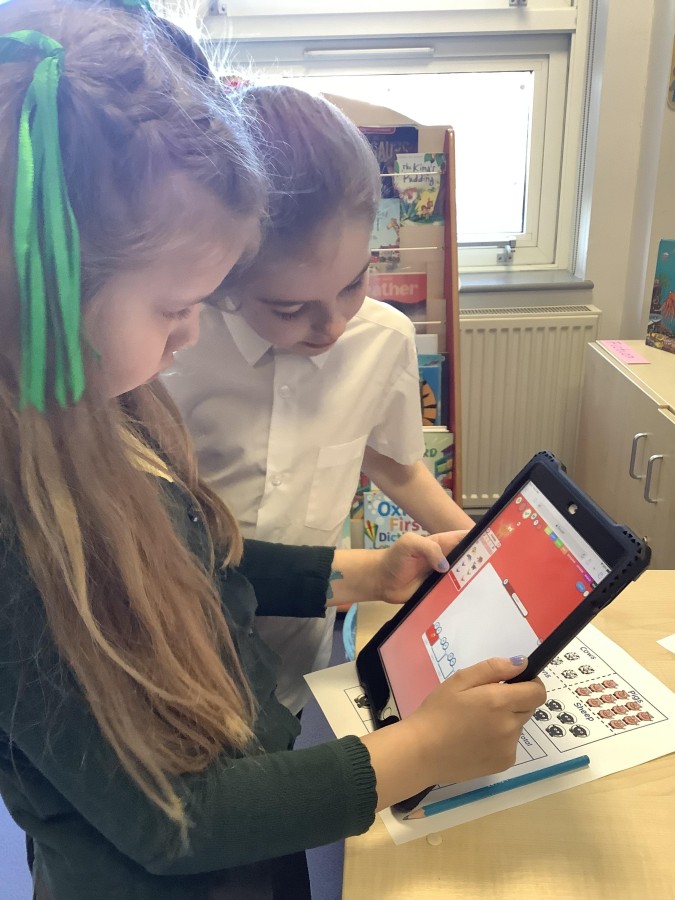
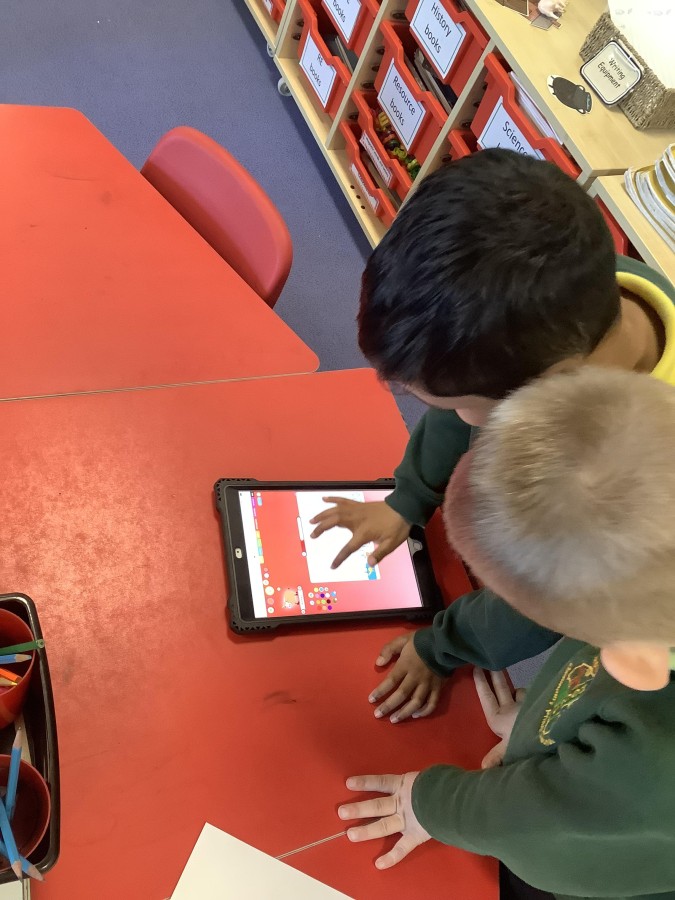
Once the children were confident, they had the opportunity to create their own pictogram using a tally chart about minibeasts. First, they had to select the correct minibeast. Then, they had to read the tally accurately. Finally, they had to represent the tally by the number of pictures on their pictogram.
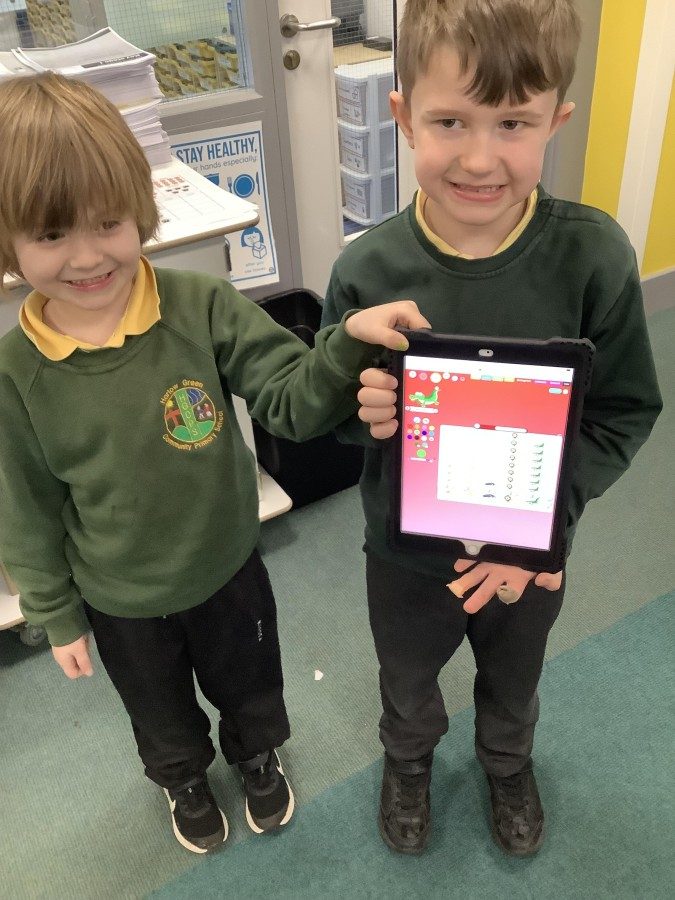
The children were then able to answer questions about the data they had represented. Using their pictogram, they could say that ladybirds were spotted the most and caterpillars the least.